Let's start by creating a simple graph using NetworkX and visualizing it with Matplotlib. In this example, we'll build a basic undirected graph with a few nodes and edges.
We will create a basic graph with n nodes using a function create_basic_graph(n), using a loop to add the nodes and random edges.
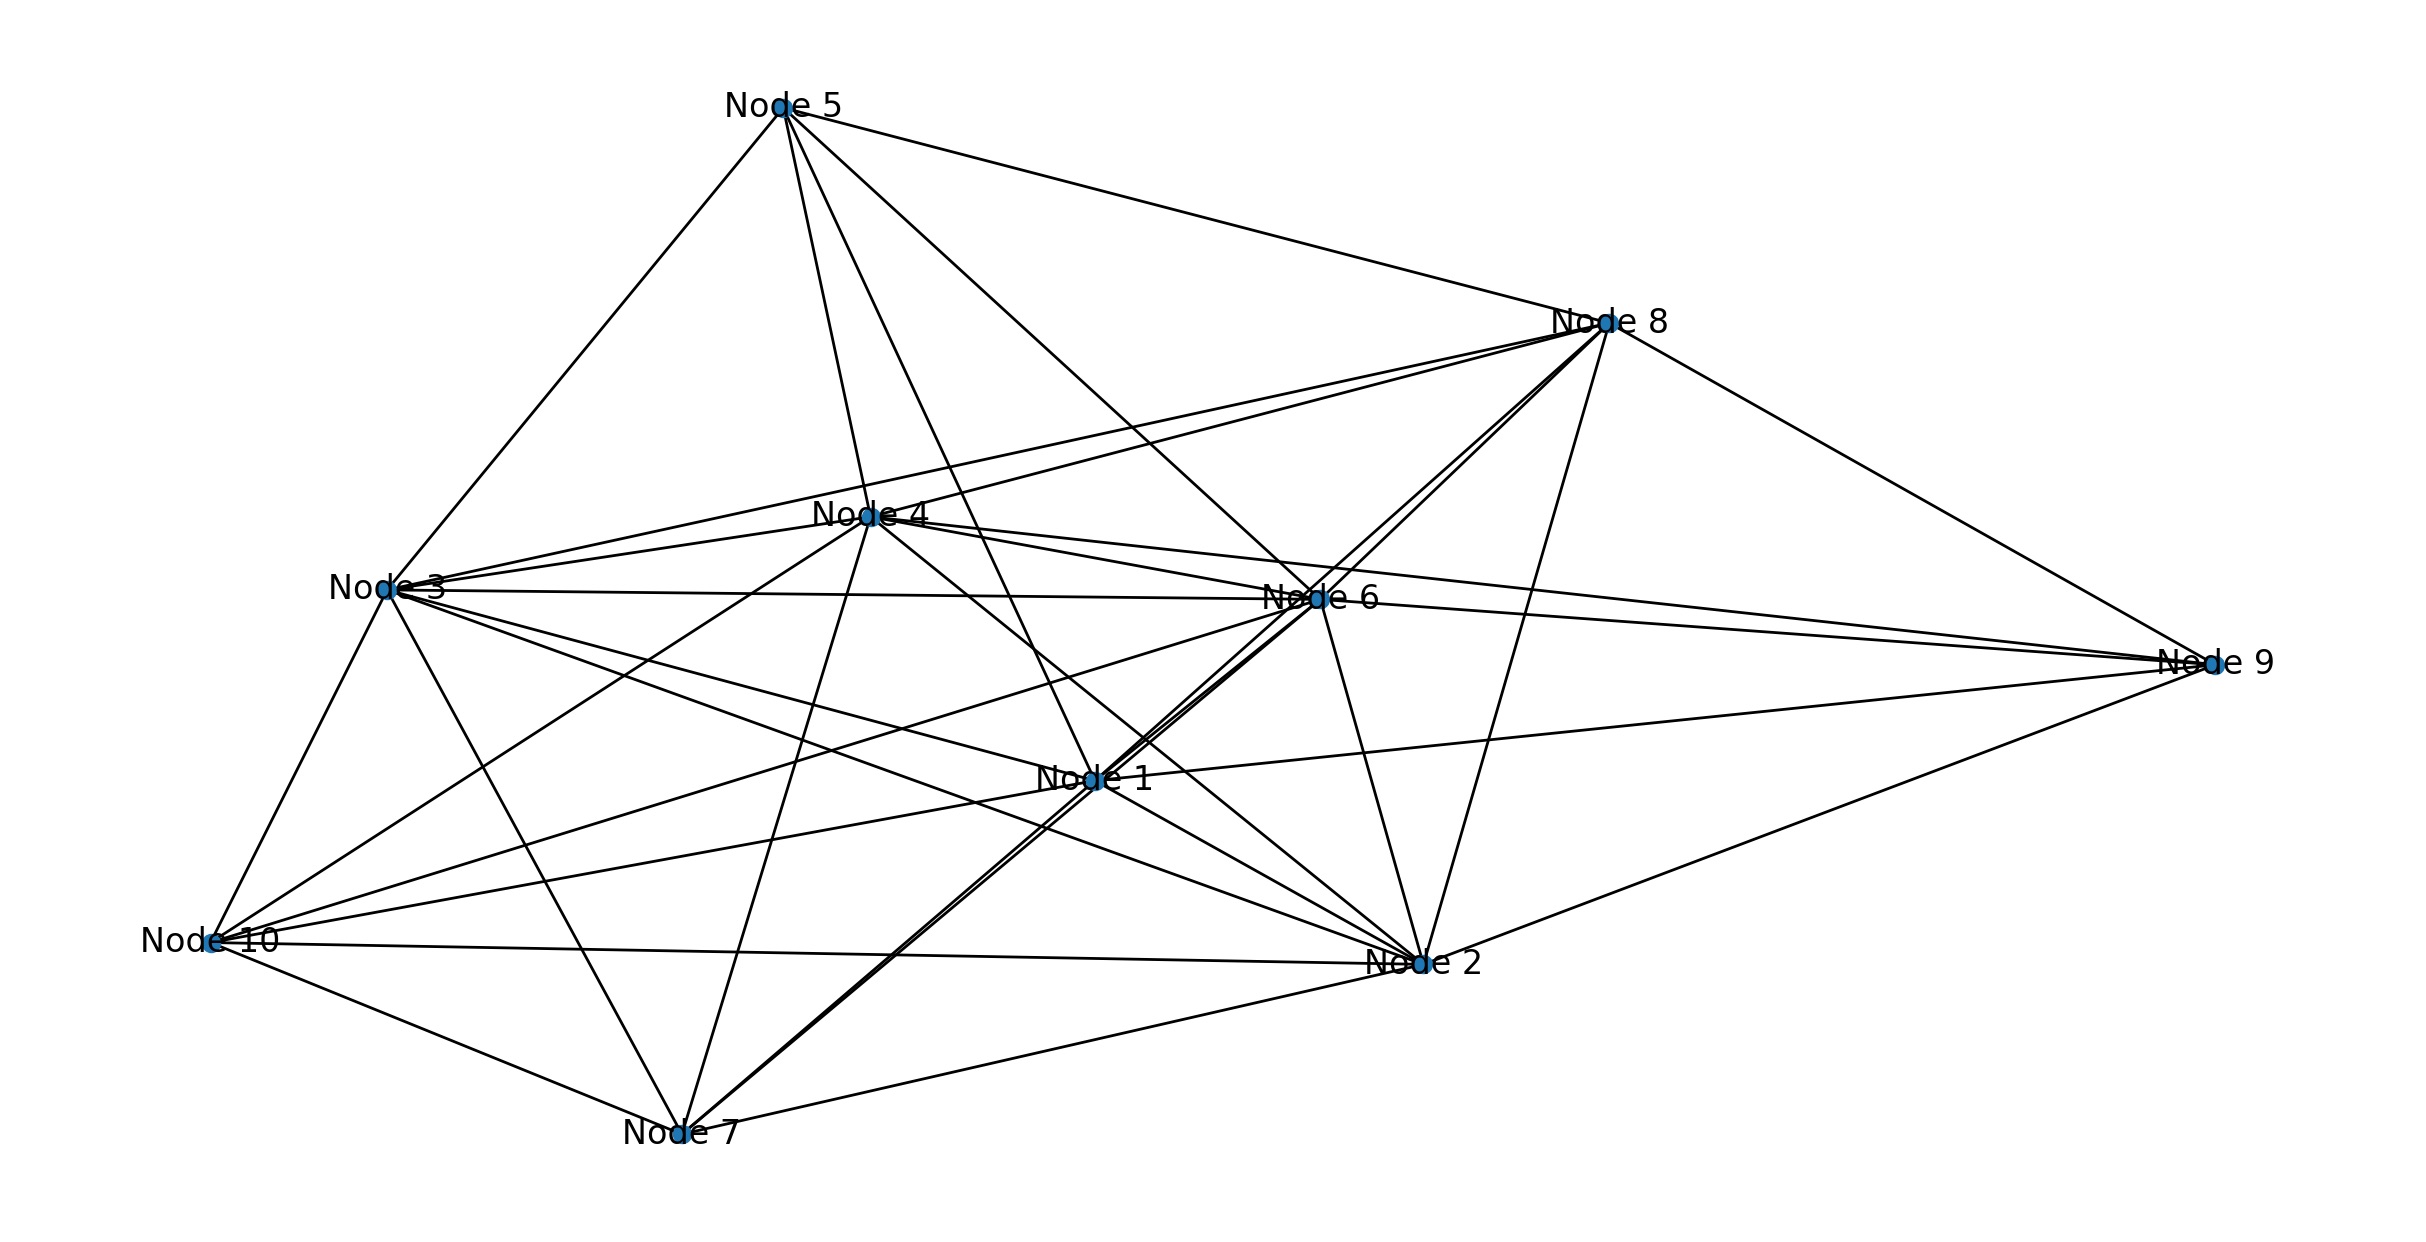
For weighted graphs, NetworkX expects each edge to be represented as a 2-tuple or 3-tuple so we will generate random pairs of nodes and add them as edges.
To create random edges between nodes, we can use random.choice to select two unique nodes for each edge. And we use a while loop to ensure that we add unique random edges between nodes until the desired number of edges is reached.
Here's the code to generate the graph above.
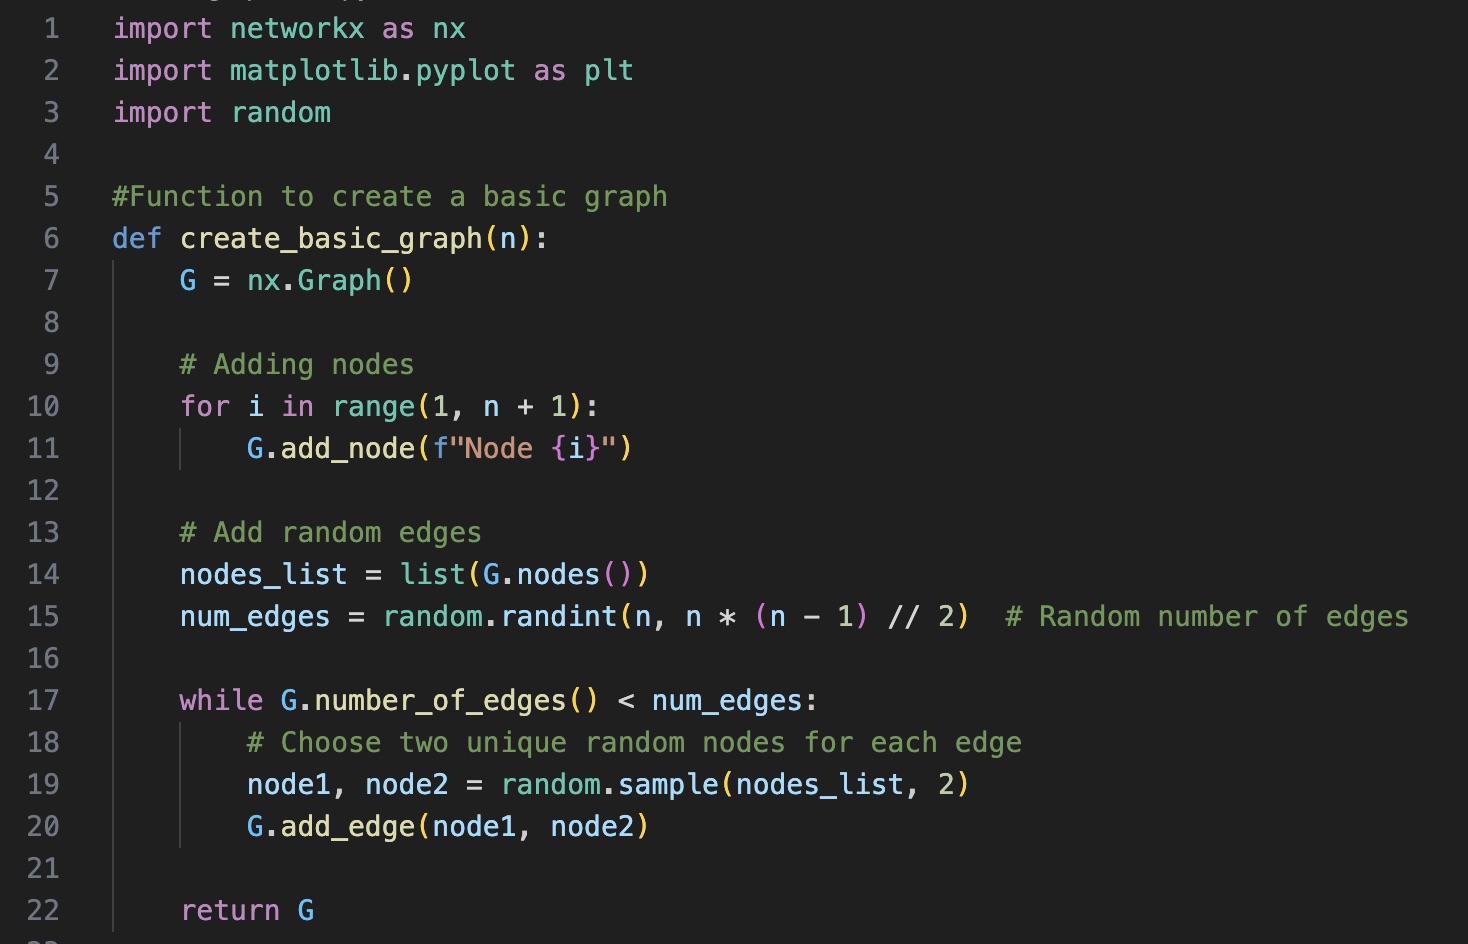
In NetworkX, creating nodes for graph is straightforward. We can use the add_node method to add nodes to a graph object. Nodes can be represented by any hashable object, such as strings, integers, or even complex objects.
Once we have the nodes in our graph, we can define the relationships between them using edges. Edges represent connections between nodes and can be directional or undirectional, depending on the type of graph you're working with.
To add edges to a graph, you can use the add_edge method.
Next, we will write the code to visualize the graph:

Customising Graph Visuals
Let's create a function customise_graph_visuals to perform some customisations.
-
Layout Algorithm: We use the spring layout (nx.spring_layout) as the custom layout algorithm to adjust the node positions.
-
Node Labels: Node labels are customized to include the node's name and its degree (number of edges connected to it). This additional information helps in understanding the graph structure.
-
Node Colors: All nodes are colored skyblue.
-
Node Sizes: Node sizes are adjusted based on the node's degree. Nodes with more connections will have larger sizes, making them more prominent.
-
Edge Colors: Edge colors are set to "gray" for all edges. You can also customize edge colors based on specific attributes or criteria.
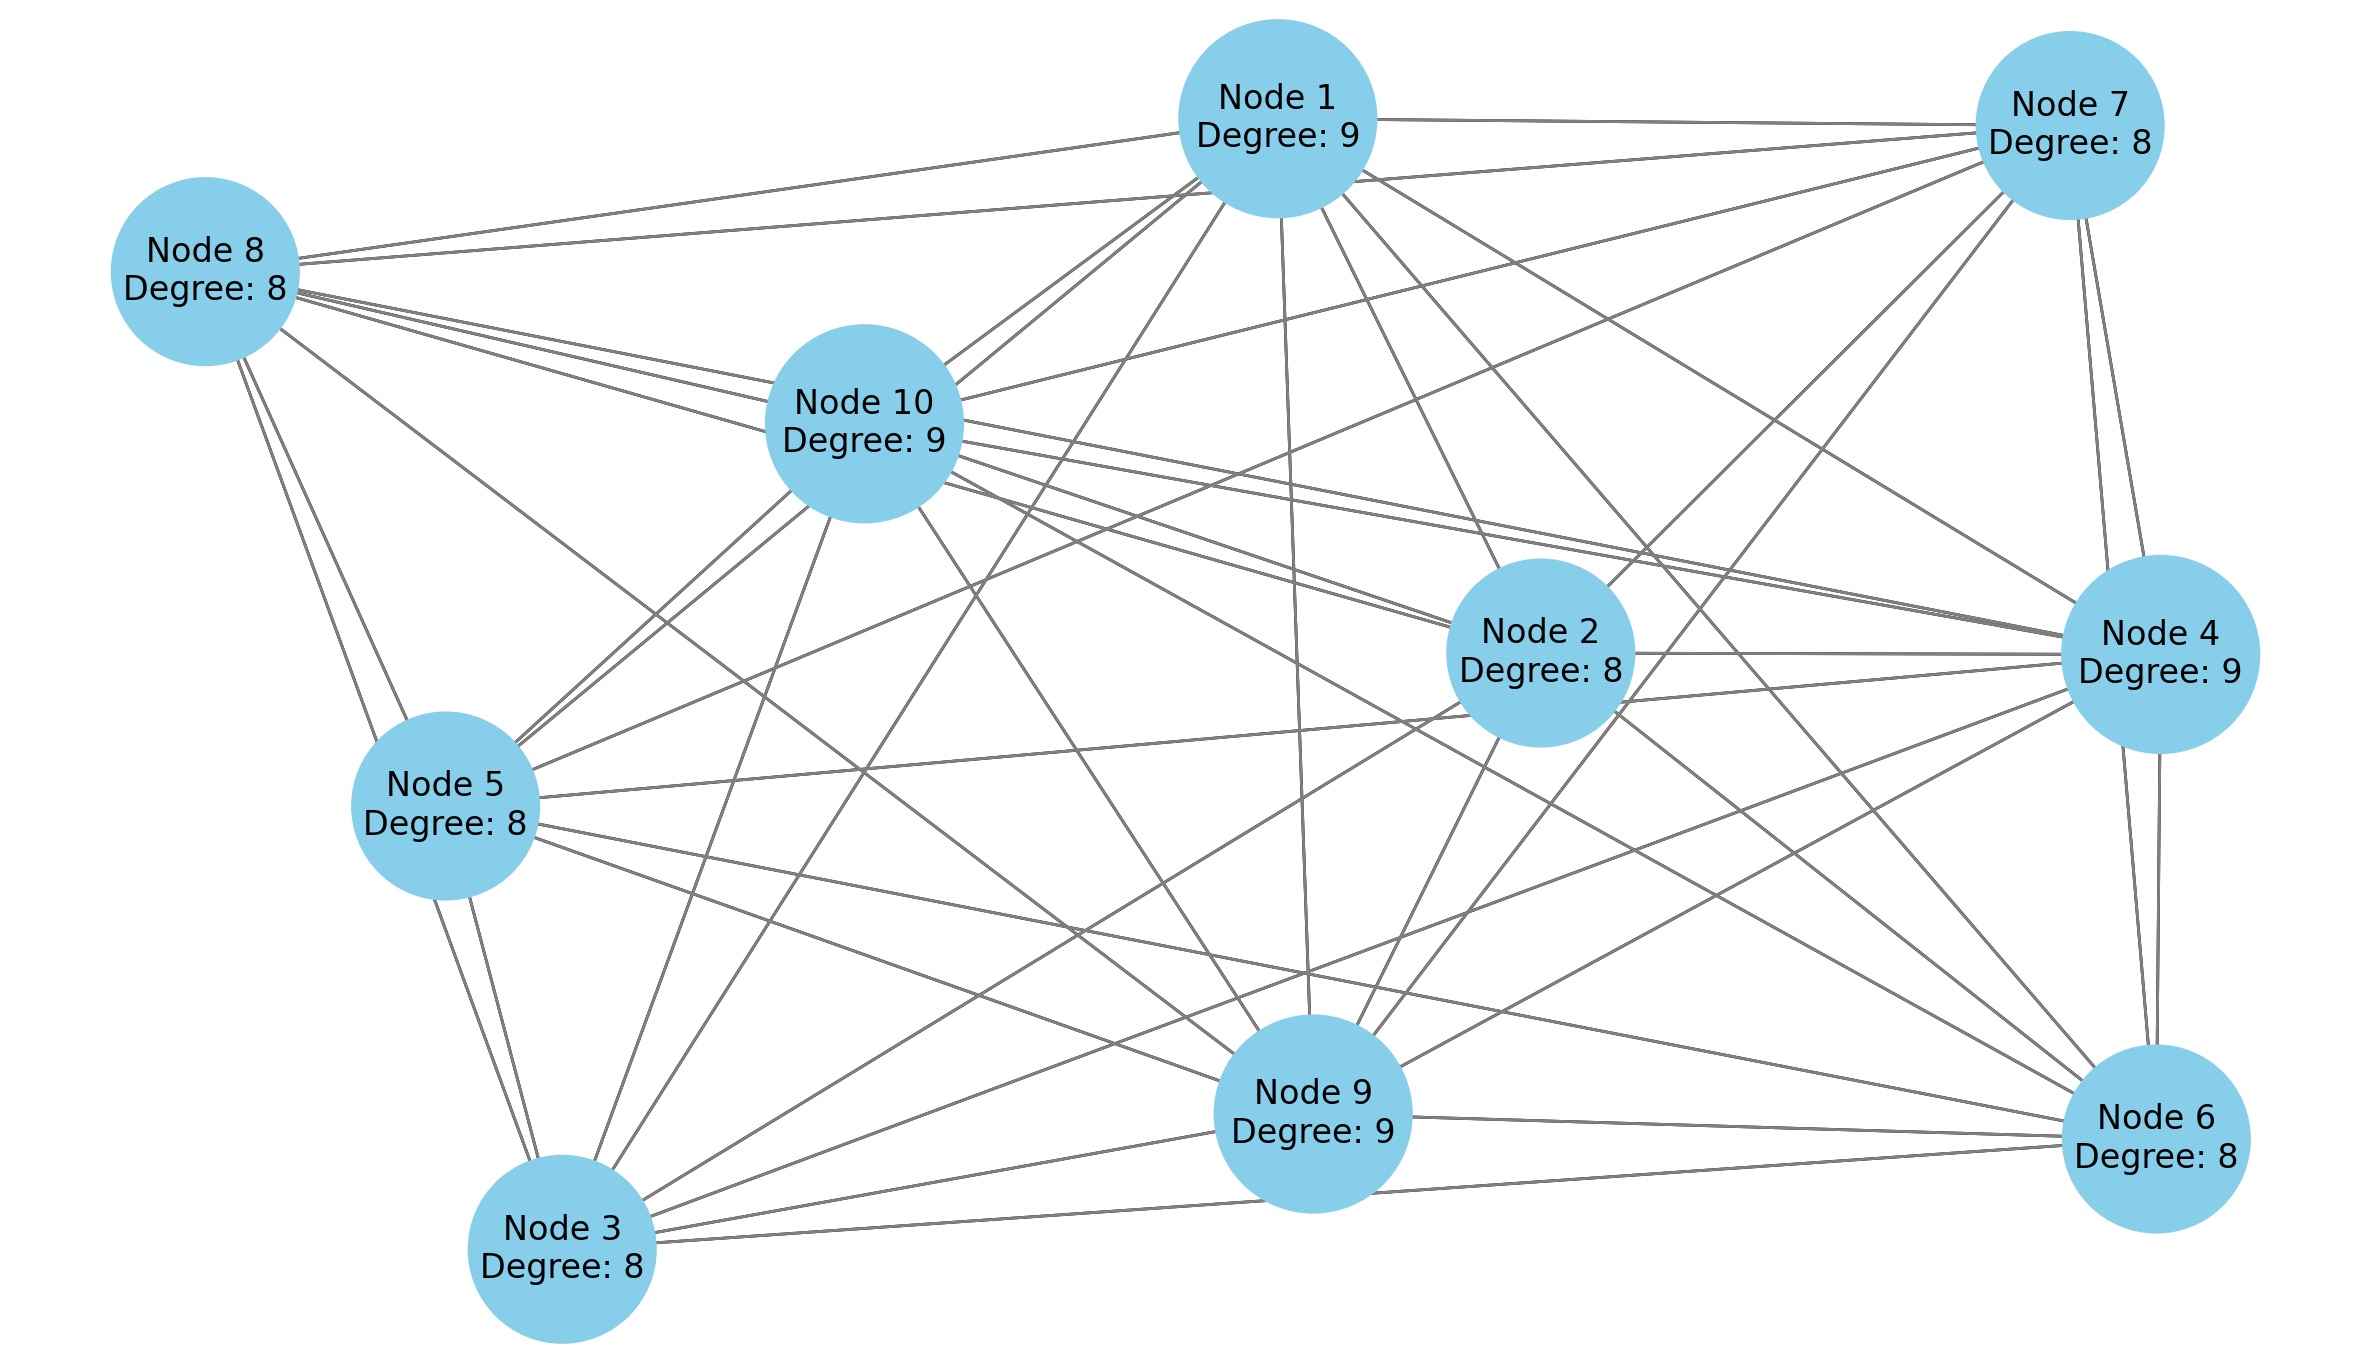
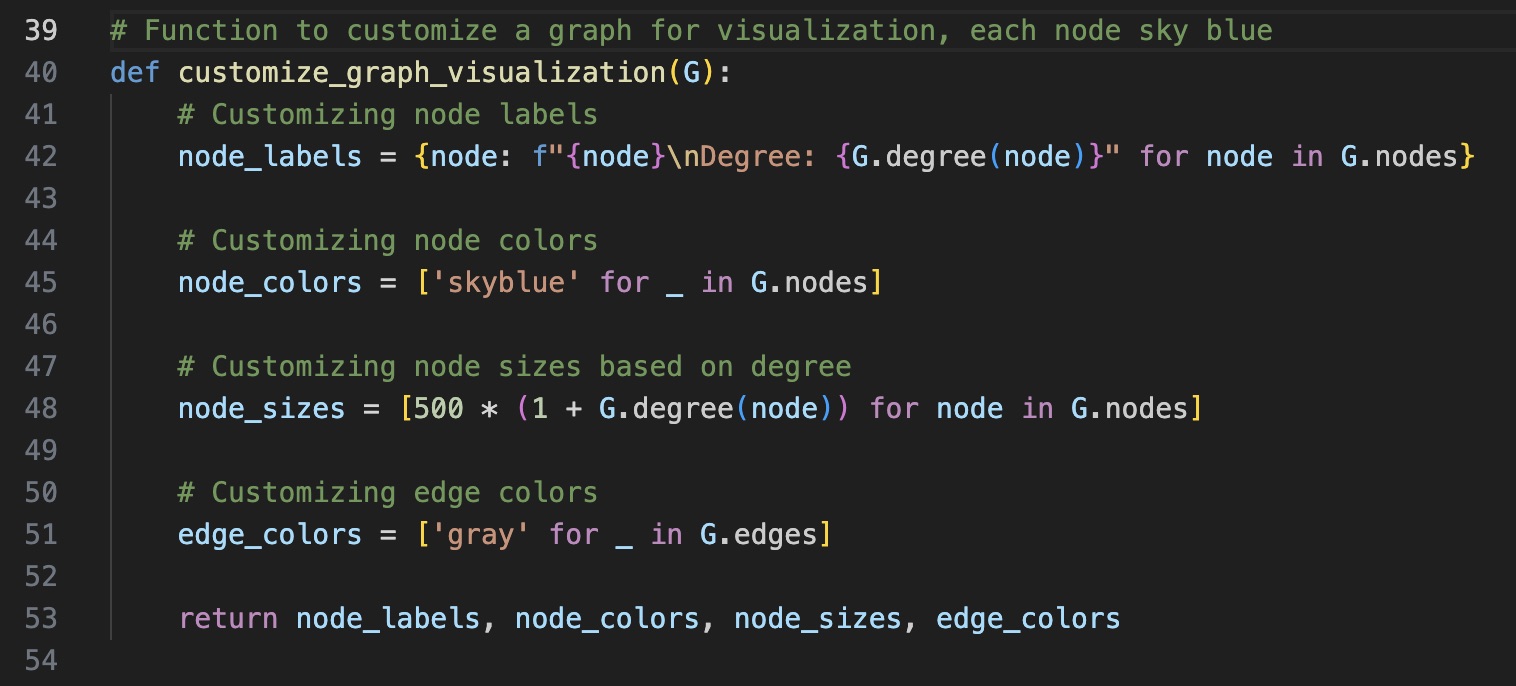
Next, let's amend the code so that it assigns a different color to each node in the graph. One common approach is to generate a list of distinct colors and assign each color to a node.
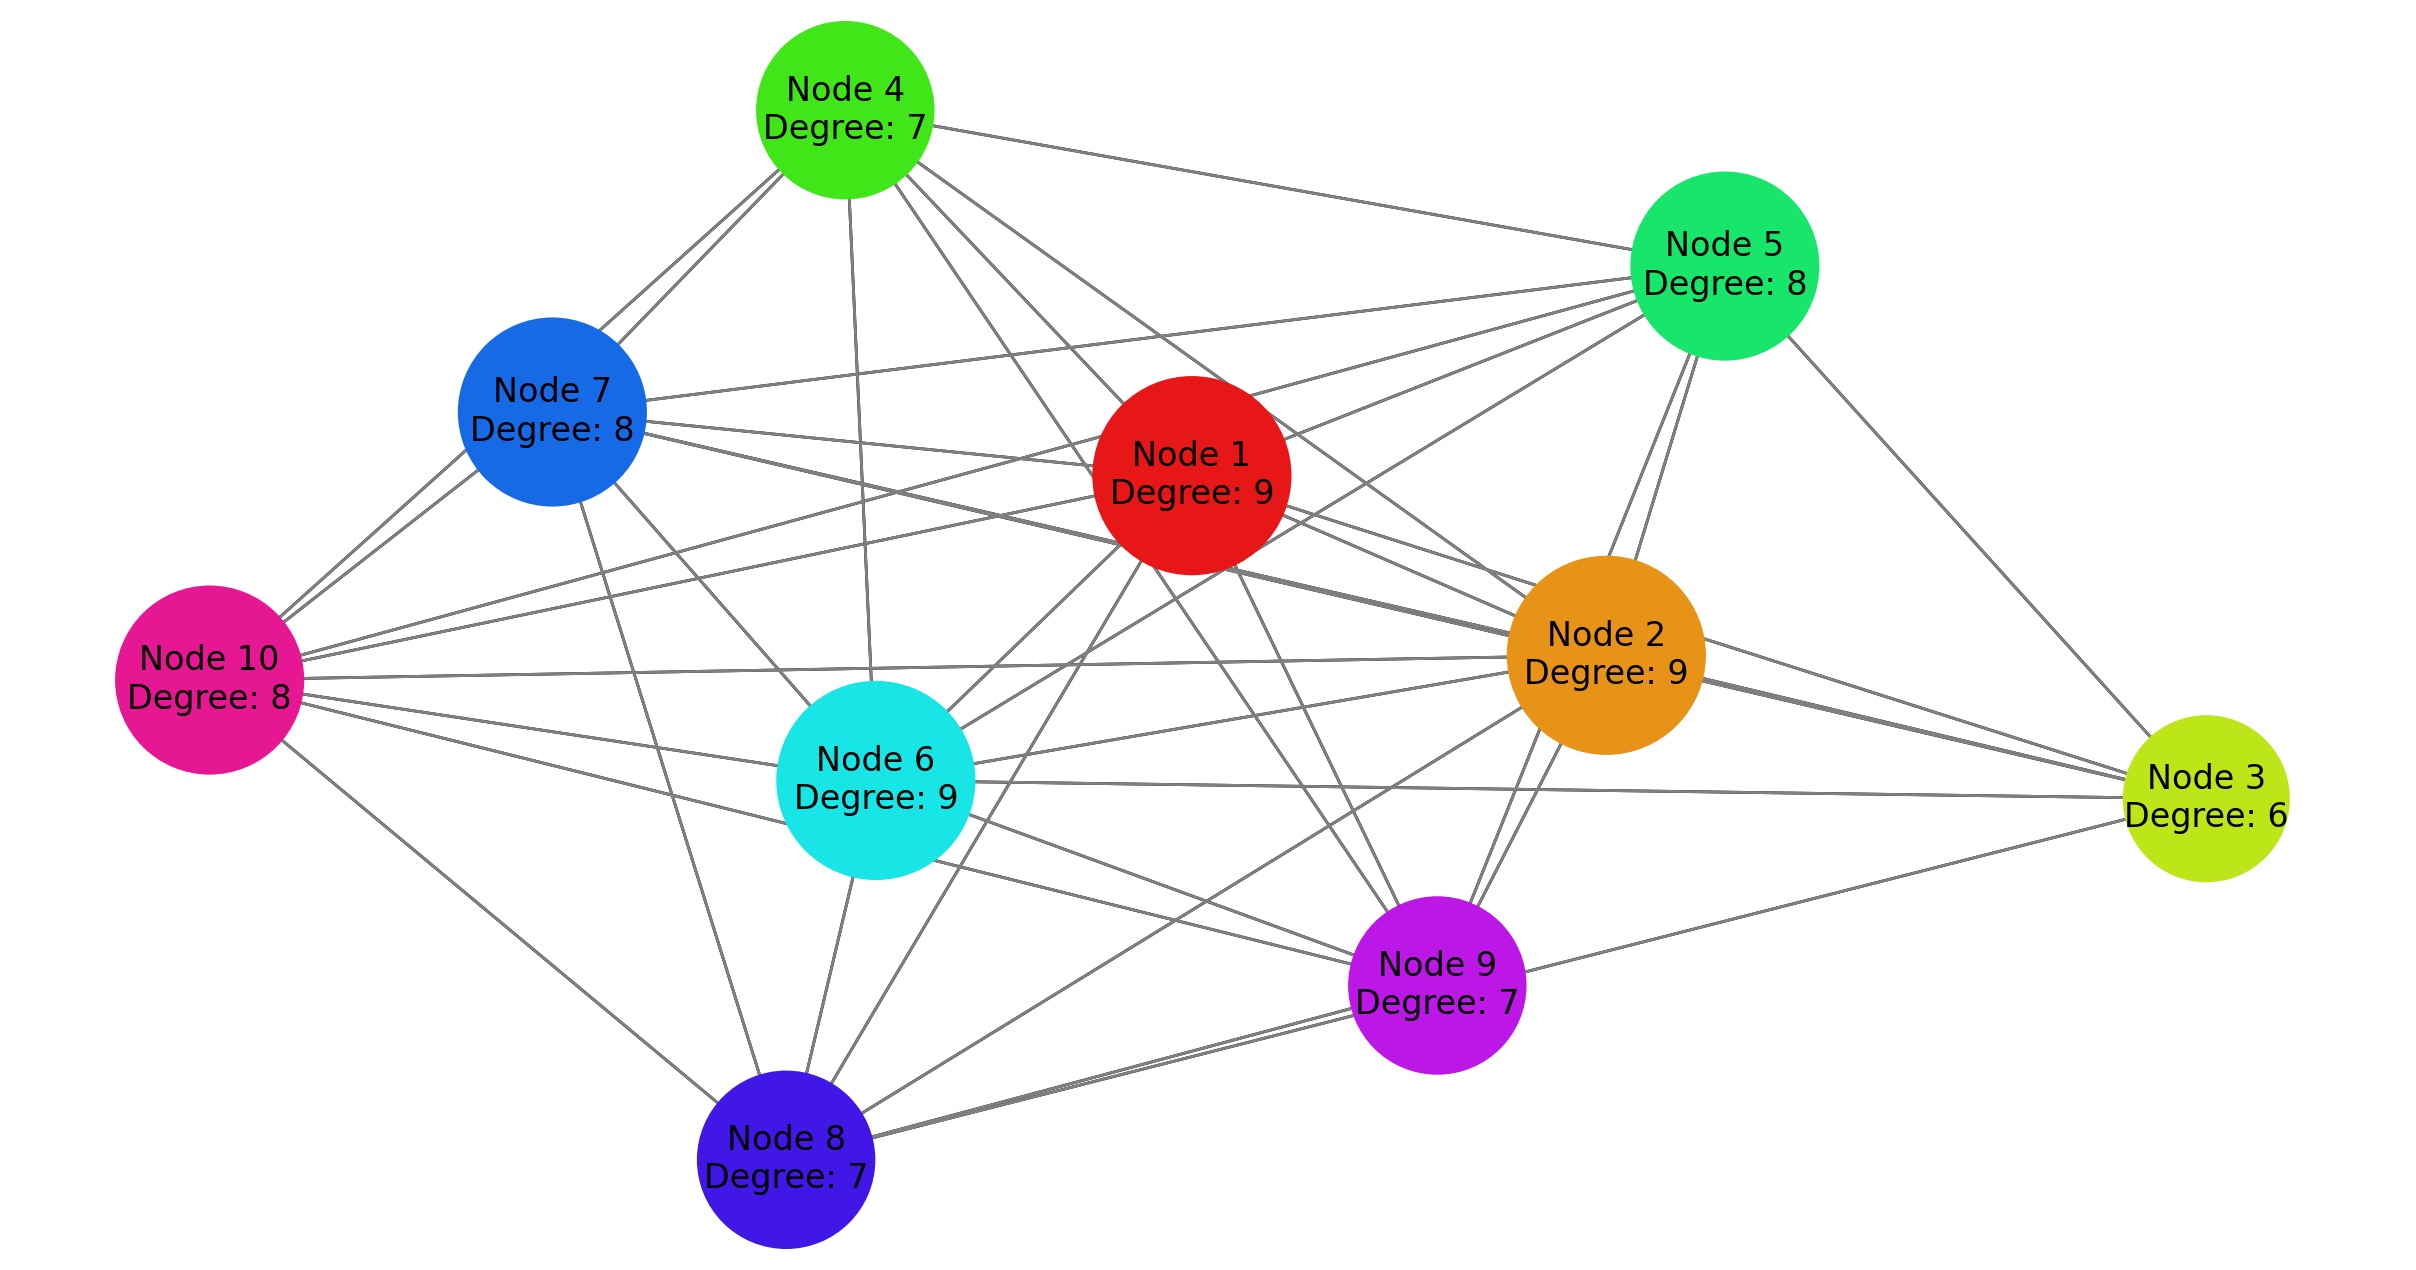
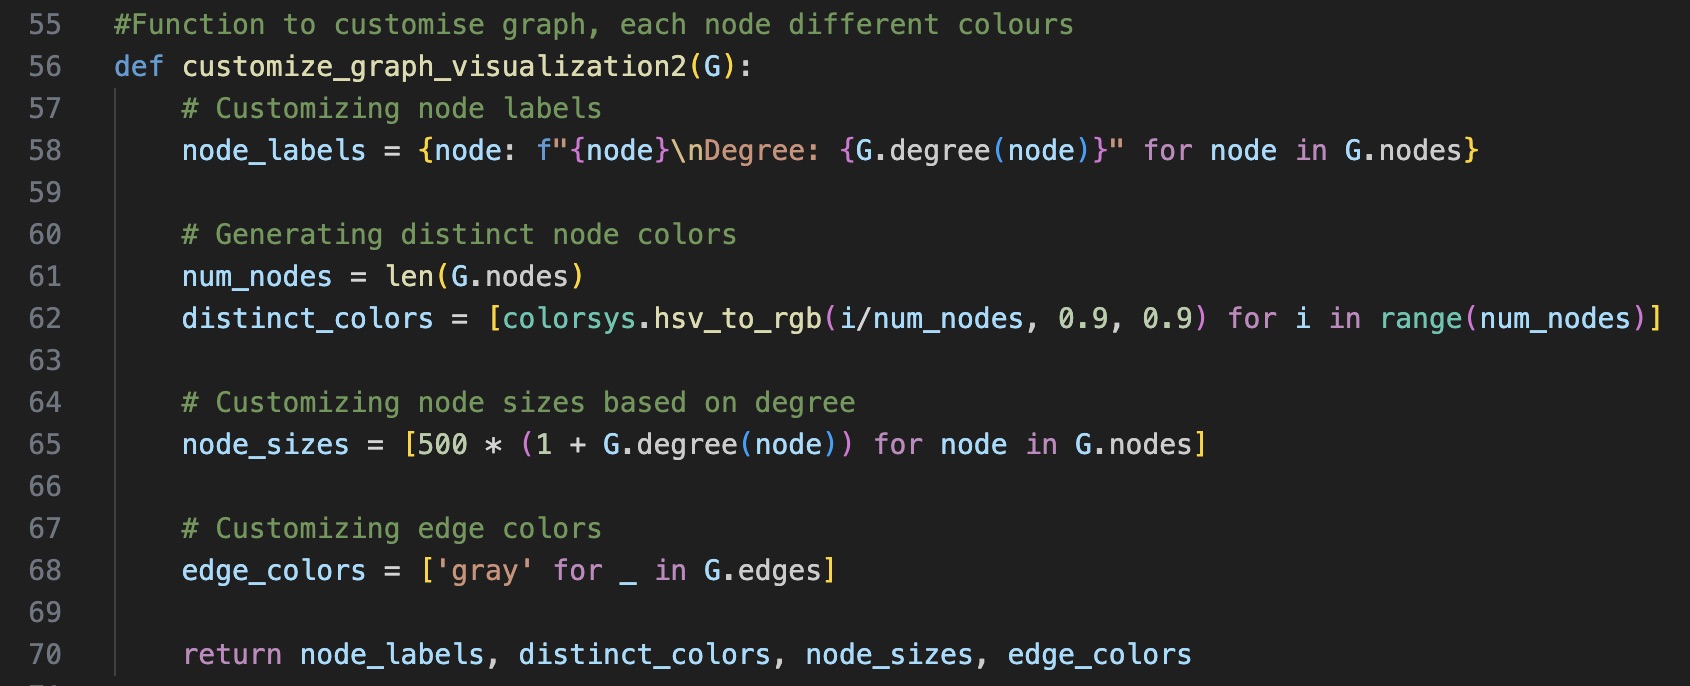
In this version of the customize_graph_visualization function generates a list of distinct colors using the HSV color space. Each node is assigned a unique color, ensuring that no two nodes share the same color. This approach allows you to have a different color for every node in the graph.
Note:
NetworkX supports various advanced features, including graph generators, graph serialization, and analysis functions. Explore the NetworkX documentation for a comprehensive list of features and examples.
This is just a basic introduction to using NetworkX for graph structure. The NetworkX documentation is a valuable resource for in-depth information and examples: https://networkx.github.io/documentation/stable/