A graph is a mathematical and data structure representation of a collection of objects and the connections or relationships between them. It consists of two main components:
- Nodes (Vertices): Represent individual objects or entities.
- Edges (Links): Represent connections or relationships between nodes.
Types of Graphs
Graphs can take different forms based on the nature of their edges and nodes. Here are the primary types:
-
Undirected Graphs: In these graphs, edges have no direction, meaning the relationship between nodes is mutual or symmetric.
-
Directed Graphs (Digraphs): In directed graphs, edges have a direction, indicating a one-way relationship between nodes.
-
Weighted Graphs: Edges in weighted graphs have associated values or weights, often used to represent the strength or cost of a relationship.
-
Bipartite Graphs: Bipartite graphs consist of two disjoint sets of nodes, and edges only connect nodes from different sets.
Graph theory, a cornerstone of modern data analysis, offers valuable insights into understanding the dynamics of complex systems. For example:
Trade network systems are the backbone of modern commerce, fostering global economic interdependence. These intricate networks weave together nations, companies, and markets, enabling the seamless flow of goods and services. Within this web of connections lies the potential for both prosperity and vulnerability.
Note: Interconnectivity underscores the reliance of entities on one another, while cascading failures illustrate the ripple effects that can occur when one link weakens or breaks.
| Interconnectivity: a sample network system |
|---|
 |
Getting Started
Python's Libraries for Graph Visualization
3 options covered in this post:
-
NetworkX: A powerful library for creating, analyzing, and visualizing complex networks.
-
Matplotlib: A versatile library for creating static 2D plots and visualizations.
-
Plotly: A library for creating interactive and visually appealing plots.
Creating the Graph
What we will do:
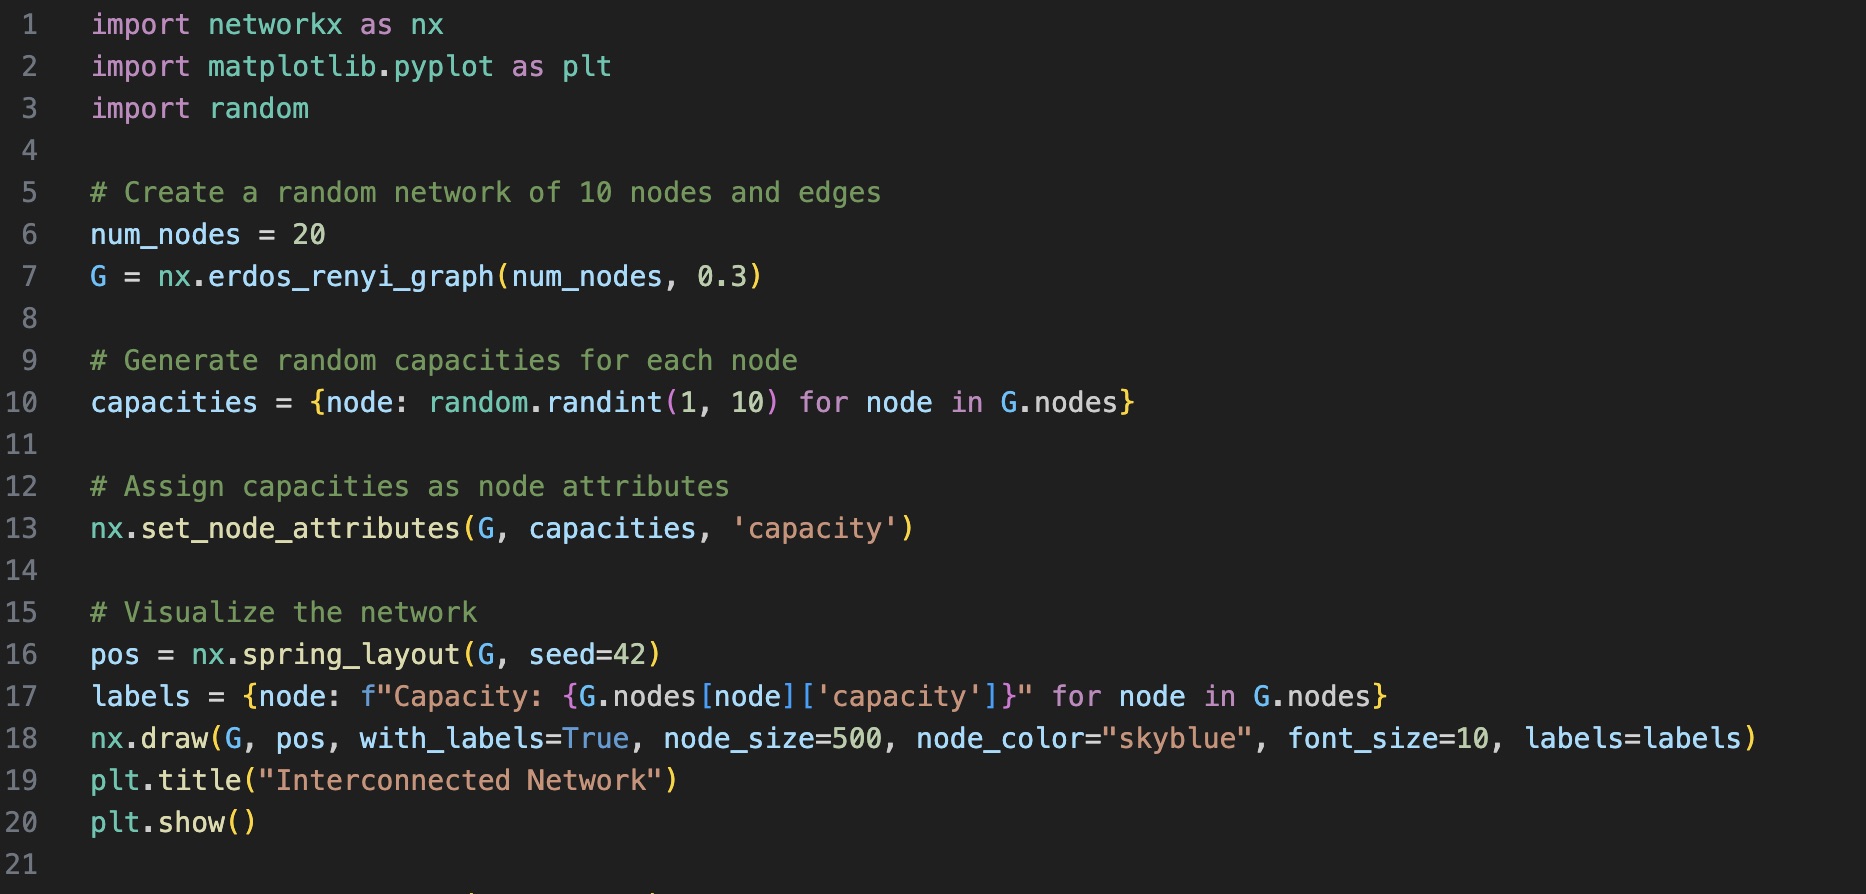
A random network of 20 nodes using the Erdős-Rényi[1] model with a probability of 0.3 edge creation.
Each node is assigned a random capacity, representing its ability to handle load.
Next, visualize the interconnected network, where nodes are labeled with their capacities.
| A Hypothetical Network of 20 Nodes |
|---|
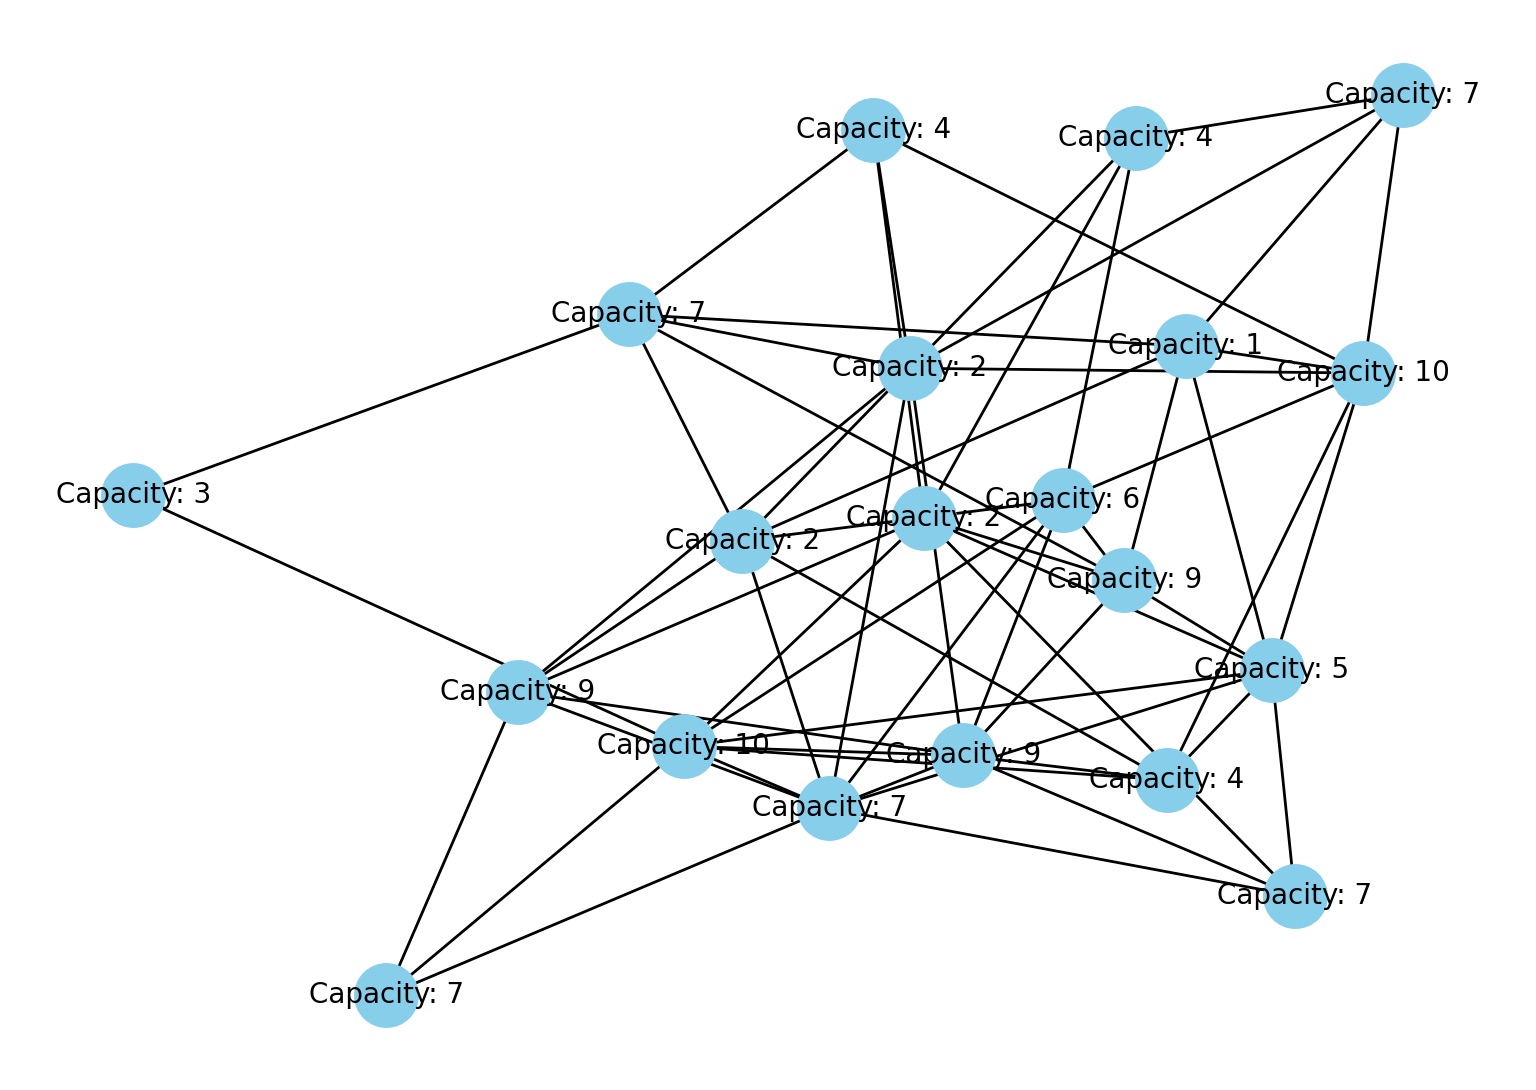 |
| Each node in the graph represents an entity or component in a complex system, and the colors of the nodes represent their individual capacities to handle transactions or loads. This initial graph showcases the interconnectivity among these entities. |
| Creating a basic network of 20 Nodes using NetworkX |
|---|
 |
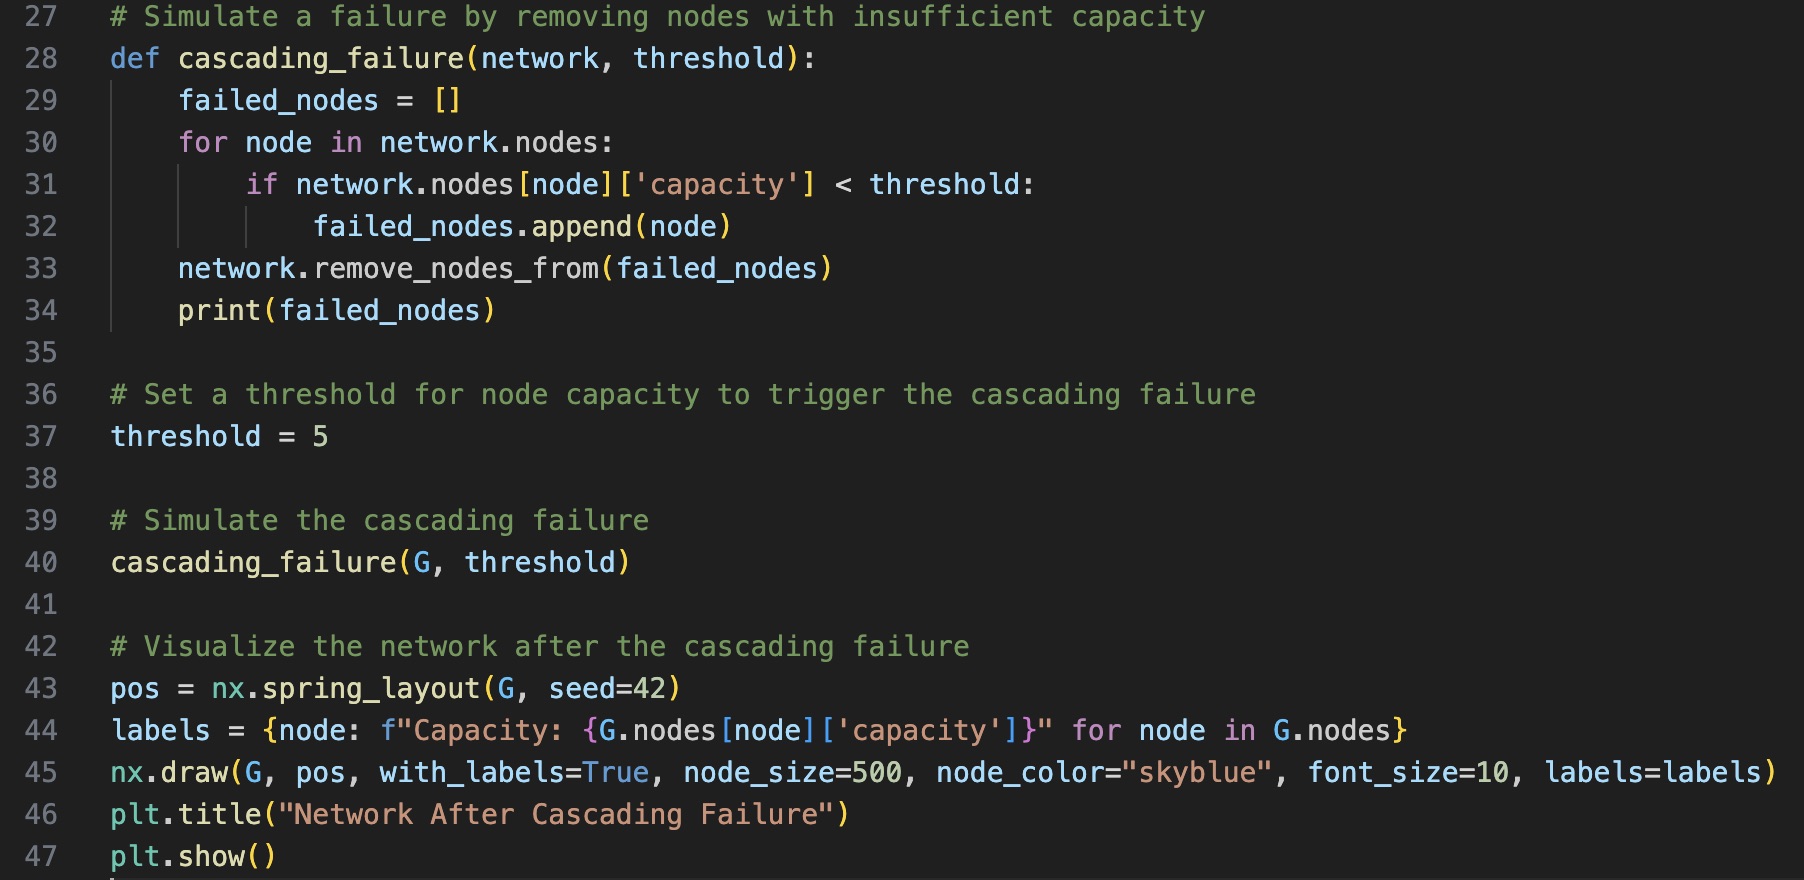
Next, simulate a failure in nodes by removing nodes with capacities below a certain threshold (in this example, the threshold is 5). This mimics a scenario where nodes cannot handle the load they receive, leading to a failure.
Finally, visualize the network after the failure to observe the impact of the failure on the interconnected systems.
| A Hypothetical Example of Network After Cascading Failures |
|---|
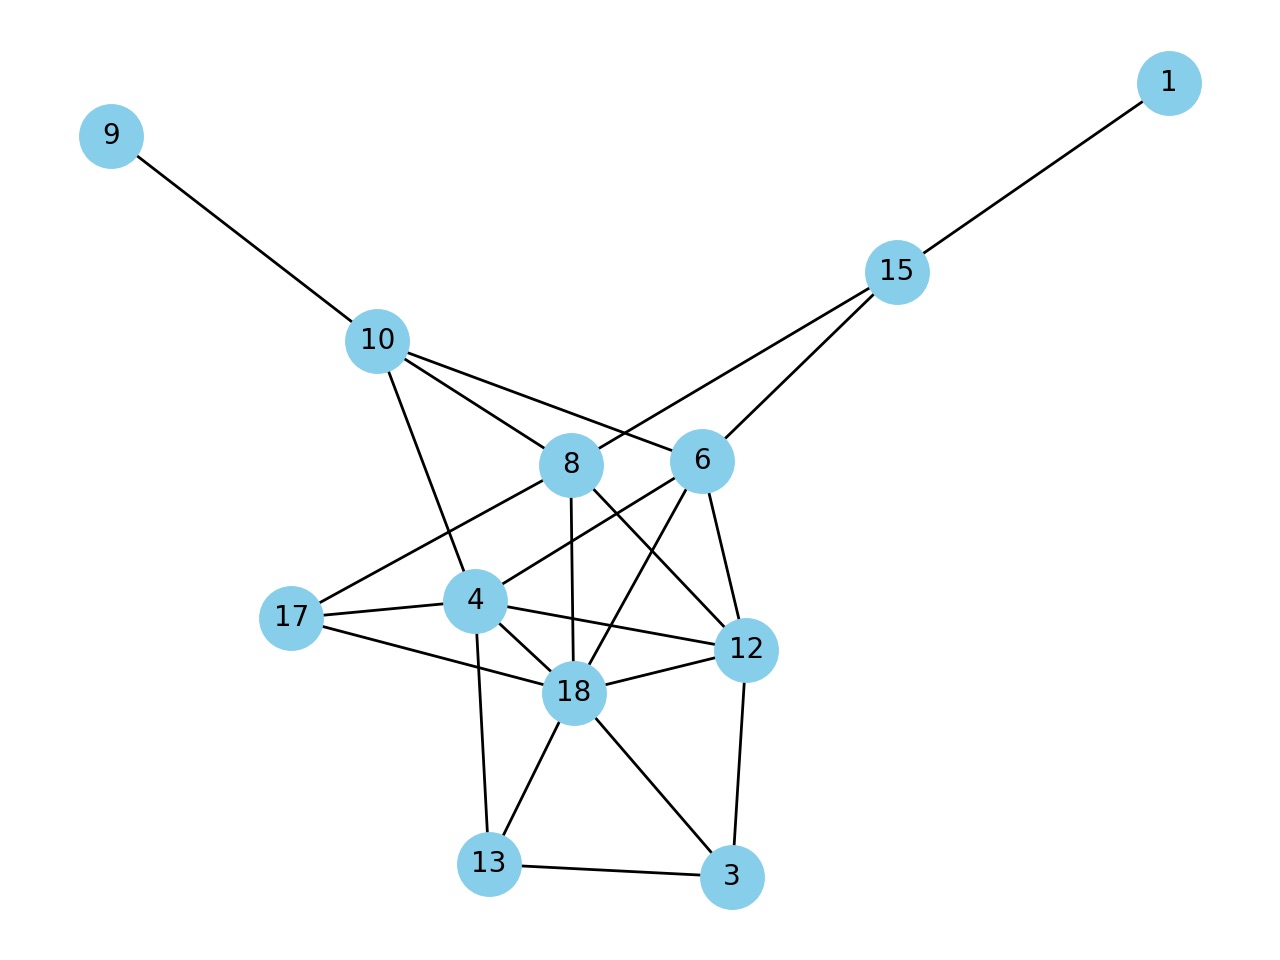 |
Briefly, this example demonstrates how the interconnectivity of systems and varying capacities of nodes can lead to cascading failures when nodes become overloaded. It illustrates the importance of understanding and managing network vulnerabilities in complex systems.
| Removing Nodes with capacity less than threshold from the Network |
|---|
 |
Footnote:
[1] The Erdős-Rényi (ER) graph model involves generating random networks by connecting nodes with a specified probability. There are two main variations of this model:
ER (n, p) and ER (n, m).
In the ER (n, p) model, you have 'n' nodes, and each pair of nodes is connected with a probability 'p.' Meanwhile, in the ER (n, m) model, you start with 'n' nodes and aim to create a graph with a fixed number of edges, 'm,' by randomly selecting pairs of nodes to connect.
Note:
NetworkX supports various advanced features, including graph generators, graph serialization, and analysis functions. Explore the NetworkX documentation for a comprehensive list of features and examples.
This is just a basic introduction to using NetworkX for graph structure. The NetworkX documentation is a valuable resource for in-depth information and examples: https://networkx.github.io/documentation/stable/