Circular layout is a visualization technique used in network analysis to represent the structure of a network in a circular arrangement. It's a practical method for gaining insights into relationships and connections within a network because:
-
Clarity: Circular layouts are particularly suitable for depicting cyclic relationships, rendering it easier to discern patterns and connections.
-
Aesthetics: These layouts offer a visually pleasing representation, apt for presentations and technical reports.
-
Efficiency: Circular layouts can efficiently represent networks containing numerous nodes and connections..
Generating Synthetic Data
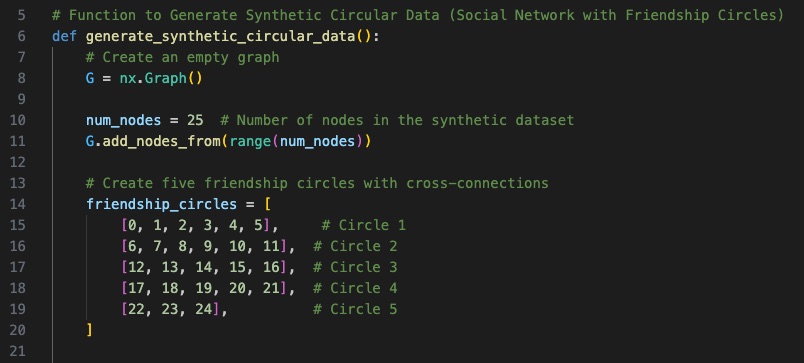
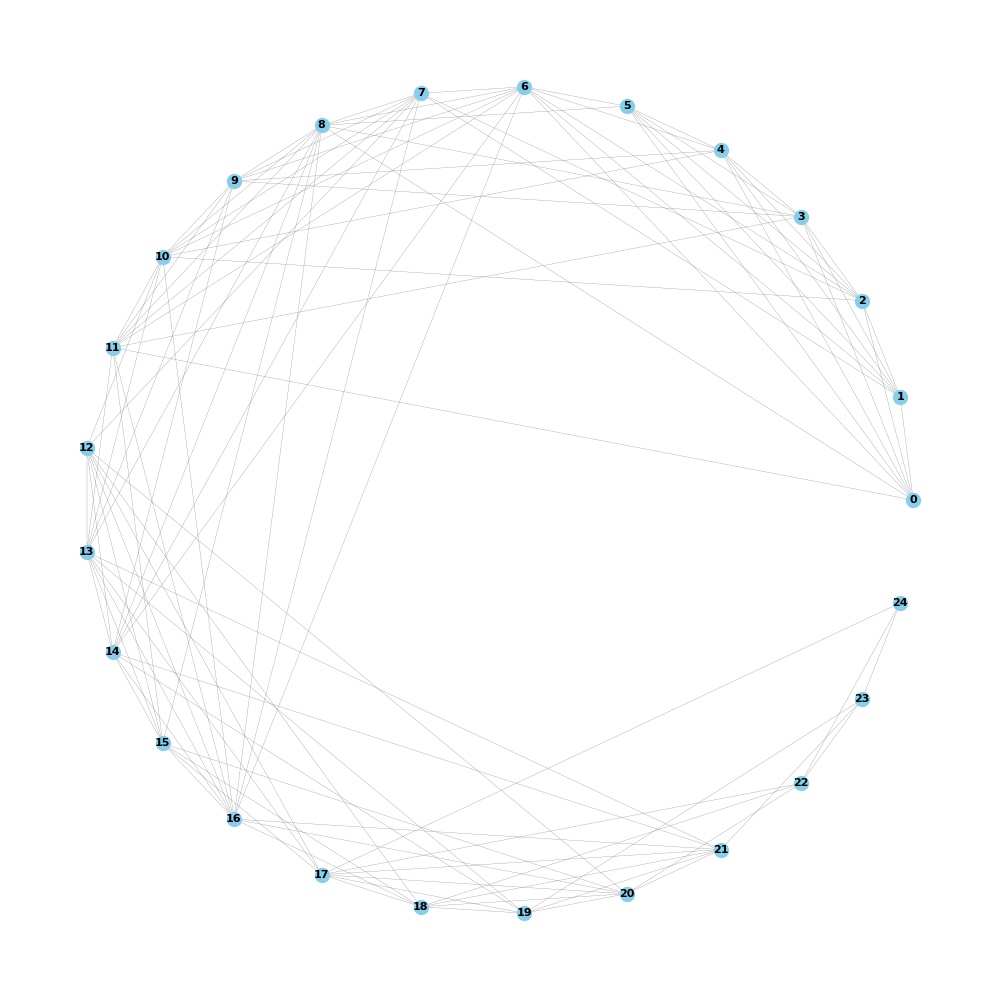
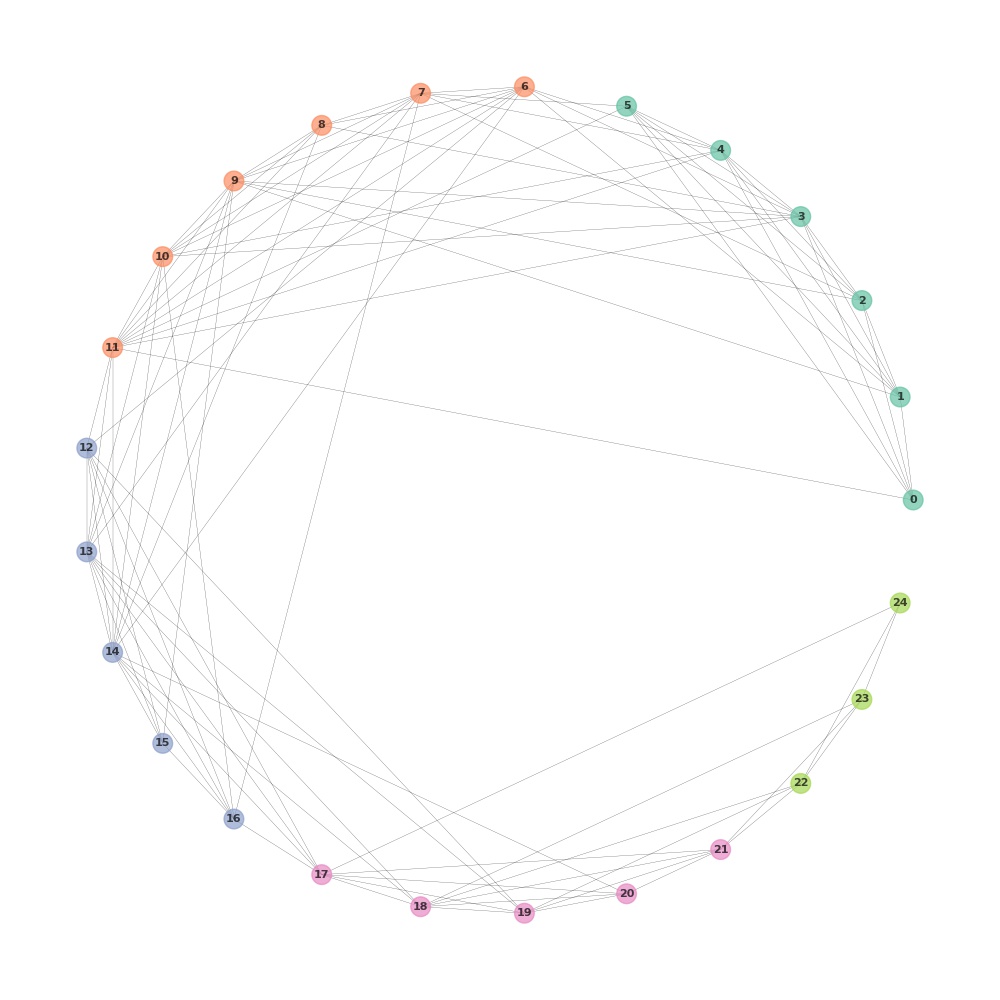
To demonstrate the Circular Layout technique, we begin by creating a synthetic network. This network encompasses 25 nodes, each denoting an entity, organized into five friendship circles, each endowed with its unique set of connections.
In this visualization:
-
Nodes: Individuals are symbolized by circles, and the lines connecting them signify relationships or connections.
-
Friendship Circles: The network is compartmentalized into five friendship circles, each encompassing several individuals. These circles represent groups of friends or collaborators.
| Friendship Circles |
|---|
 |
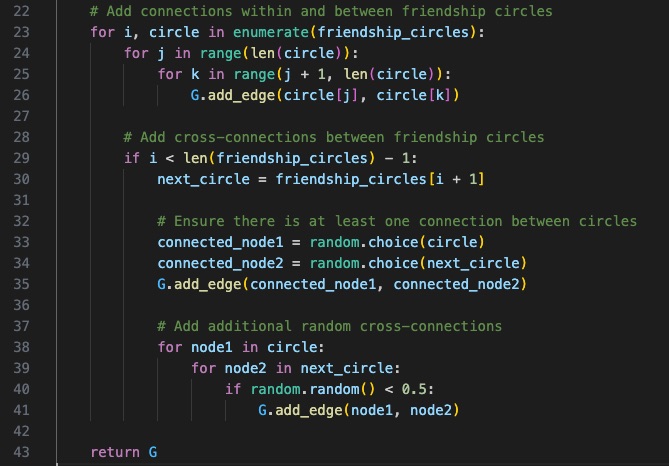
- Cross-Connections: To introduce complexity, we have incorporated cross-connections between neighboring friendship circles, facilitating indirect relationships and interactions.
| Adding Connections |
|---|
 |
The Network
| Friendship Circles |
|---|
 |
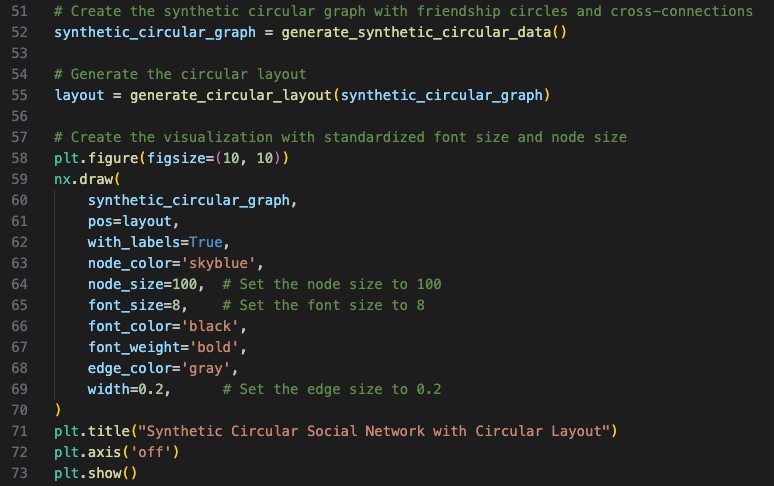 |
- The synthetic circular graph is created using the generate_synthetic_circular_data function.
- The circular layout positions are generated using the generate_circular_layout function.
- The visualization is created using nx.draw.
- Node properties such as color, size, font size, font color, and font weight are customized.
- Edge properties like color and width are also adjusted.
Colouring Different Circles
Now we will differentiate the friendship circles with different colours.
-
Generate Distinct Colors: Start by getting a list of distinct colors from the Seaborn color_palette.
-
The Set2 argument specifies the name of the color palette to use from Seaborn's predefined palettes. The number of colors generated is determined by the len(friendship_circles) to match the number of friendship circles in our social network.
-
Loop through each friendship circle using for i, circle in enumerate(friendship_circles).
-
Obtain the color associated with the current circle by indexing the colors list with colors[i].
-
Next, loop through all the nodes within the current circle using for node in circle. For each node, assign the color obtained in previous step to that node in the node_colors dictionary. This effectively maps each node to its associated color based on its friendship circle.
Finally, return a list of colors for all nodes in the graph, where the order of colors matches the order of nodes in G.nodes() in order to apply these customized node colors when visualizing the network using NetworkX.

- Assign Colors to Nodes: For each node in a circle, assign the color associated with that circle.
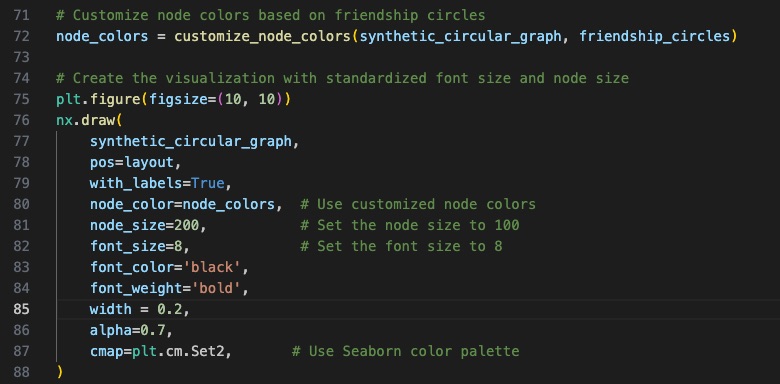
- Visualization: Circular social network where nodes within each circle have the same color, making it easy to identify and analyze different friendship circles.
Other Enhancements:
-
Node Size: Each entity is represented by a circle, with the circle's size reflecting the entity's significance or influence within the network. Larger circles denote more influential entities.
-
Edge Thickness: The lines connecting nodes (edges) exhibit varying thickness, indicating the strength or frequency of interactions between entities. Thicker lines signify more robust connections.