Recap:
At its core, Social Network Analysis (SNA) focuses on networks, which are composed of nodes (entities) and edges (connections). These networks can represent various relationships, be it in online communities, organizations, or any interconnected system.
Online social networks include the likes of Mastodon, Facebook and X (formerly Twitter), offline networks, such as collaborations within a workplace, also hold relevance. Bipartite networks are another category, which capture connections between two distinct types of nodes
Communities
Communities, within the context of social networks, are essentially clusters of nodes that exhibit a higher degree of interconnectedness among themselves compared to the nodes outside the cluster. Communities are not always explicitly defined or predetermined; instead, they often emerge organically from the interactions and relationships between nodes.
These communities can be thought of as subgroups or cliques within a larger network. They represent the natural tendency of individuals or entities within a network to form connections and associations with others who share common attributes, interests, or behaviors. The identification and analysis of communities are important for understanding the structure and dynamics of social networks. By pinpointing these cohesive subgroups, we gain insights into how information, influence, and interactions flow within the network.
In practical terms, understanding and identifying communities in social networks have significant implications. It can aid in targeted marketing, recommendation systems, fraud detection, and even the study of societal and cultural trends. By unraveling the structure of communities within social networks, businesses, researchers, and organizations can make more informed decisions and optimize their strategies for engaging with their target audience.
Detecting Communities
Communities in social networks are not limited to a single definition or criterion. Different algorithms and methods can identify communities based on various factors, such as network topology, content shared, or user attributes. The choice of method depends on the specific research question or application.
To perform community detection on a real-world network, we would typically use community detection algorithms such as Louvain Modularity, Girvan-Newman, or others to automatically identify communities based on network topology and connectivity patterns.
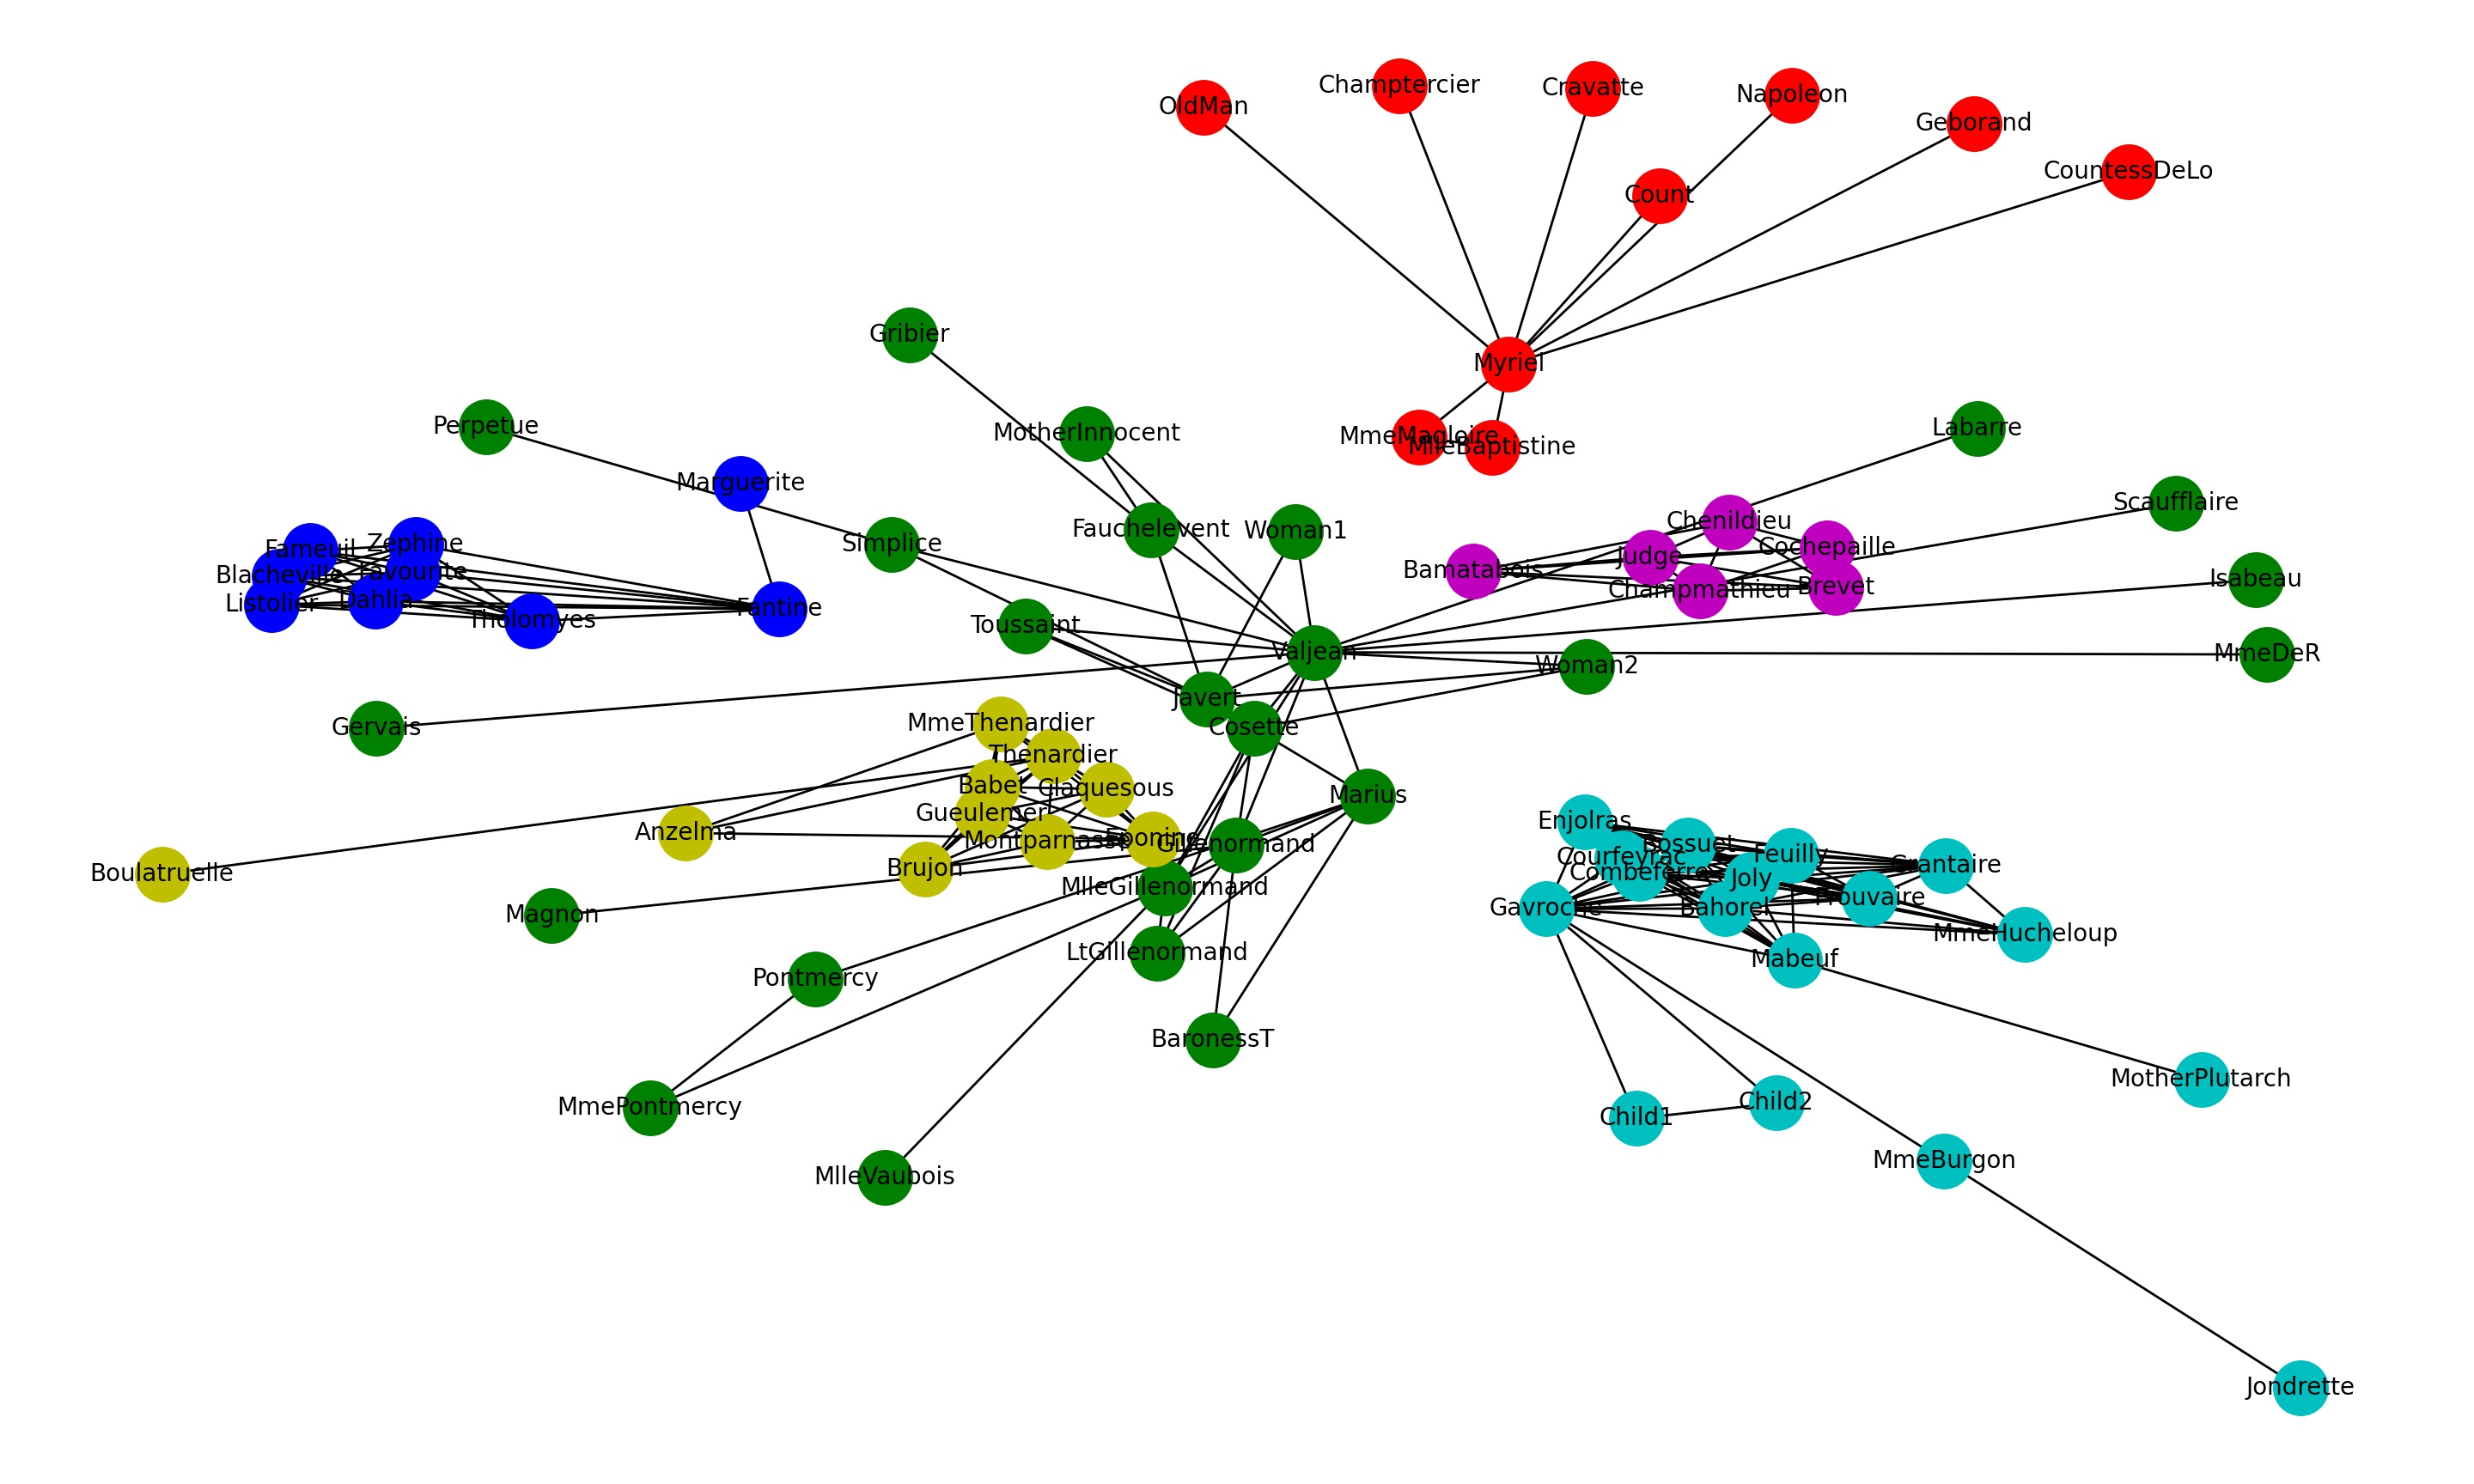
We will apply a community detection algorithm (the Louvain Modularity algorithm) to the generated synthetic social network and visualize the detected communities.
Louvain Modularity
Here's how the Louvain algorithm detects communities:
-
Initialization:Initially, each node in the network is treated as a separate community.
-
Modularity Calculation: The algorithm starts with all nodes in separate communities and calculates the modularity of this initial partition.
-
Modularity is a measure that evaluates the quality of a community assignment. It measures the difference between the number of edges within communities and the expected number of such edges in a random network with the same degree distribution.
-
Community Aggregation: The algorithm iteratively aggregates communities to improve modularity. It does so by considering each node in turn and evaluating the change in modularity when it is moved to a neighboring community or a new community is created for it. Nodes are moved to communities that lead to an increase in modularity. This process continues until no further improvement can be achieved.
-
Repeat: Steps 2 and 3 are repeated iteratively until no further improvement in modularity can be achieved by moving nodes between or merging communities.
-
Final Partition: The final result of the Louvain algorithm is a community partition that maximizes the modularity score.
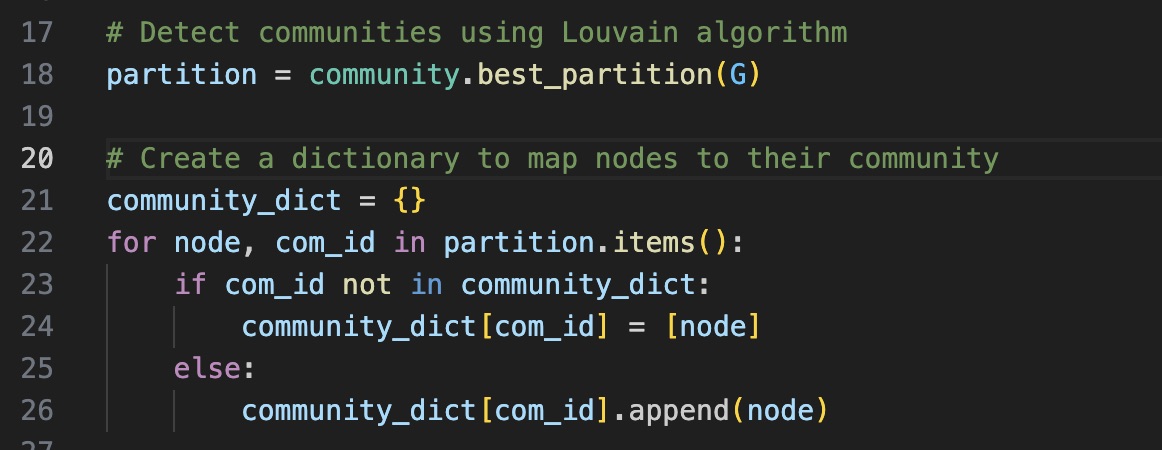
The algorithm returns a mapping of nodes to communities, where each node is assigned to a specific community.
Hands On
| Steps |
Code |
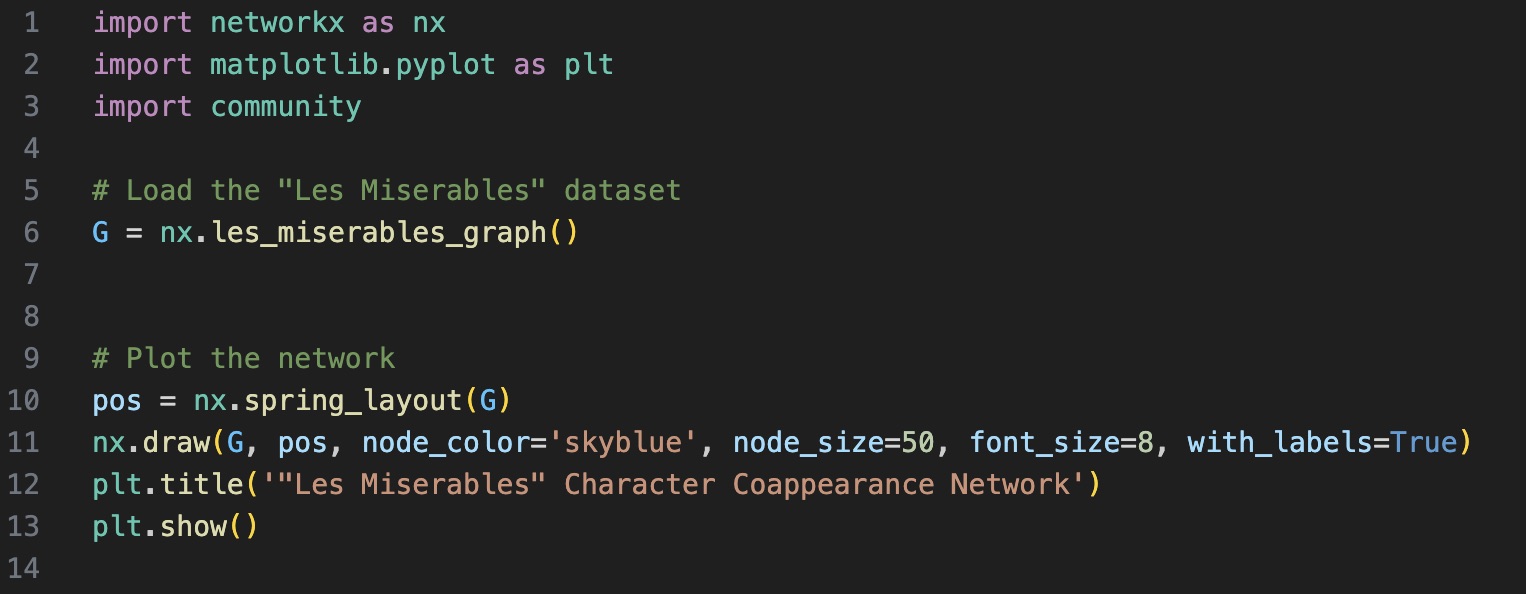
| Load the Les Miserables Dataset and visualise it |
 |
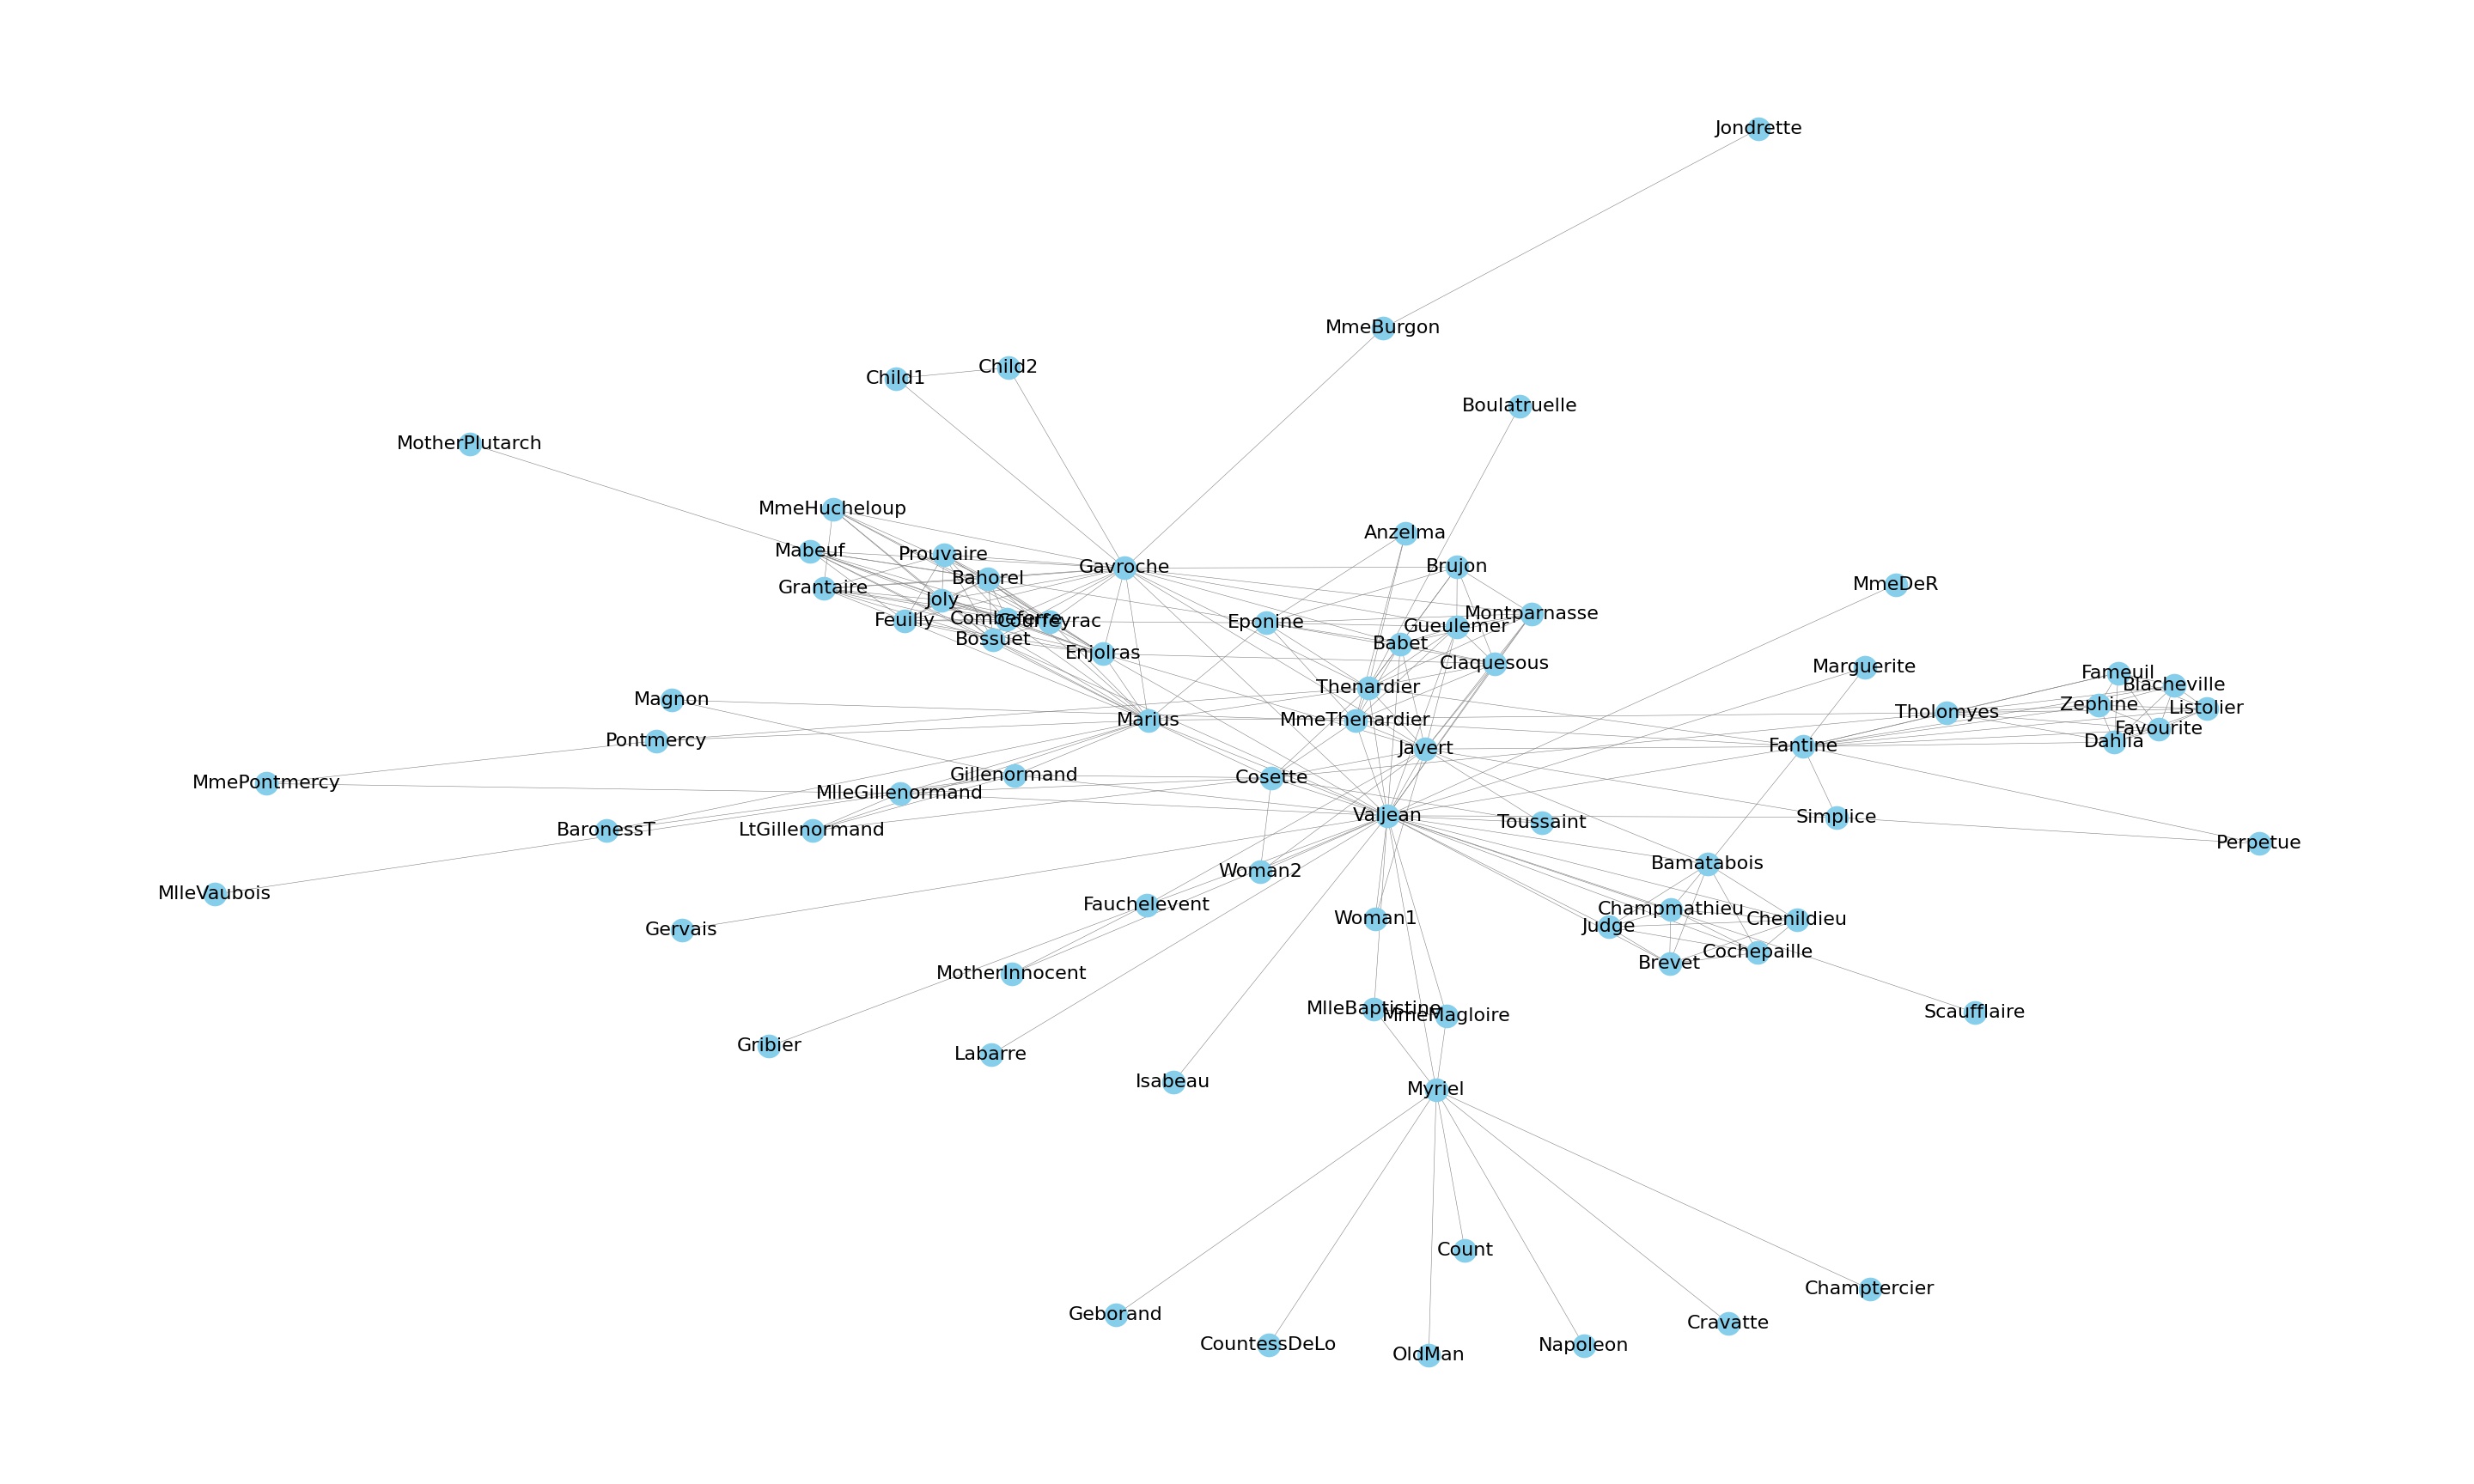
| Les Miserables Network |
 |
| Detect and map nodes to communities |
 |
| Visualise the communities |
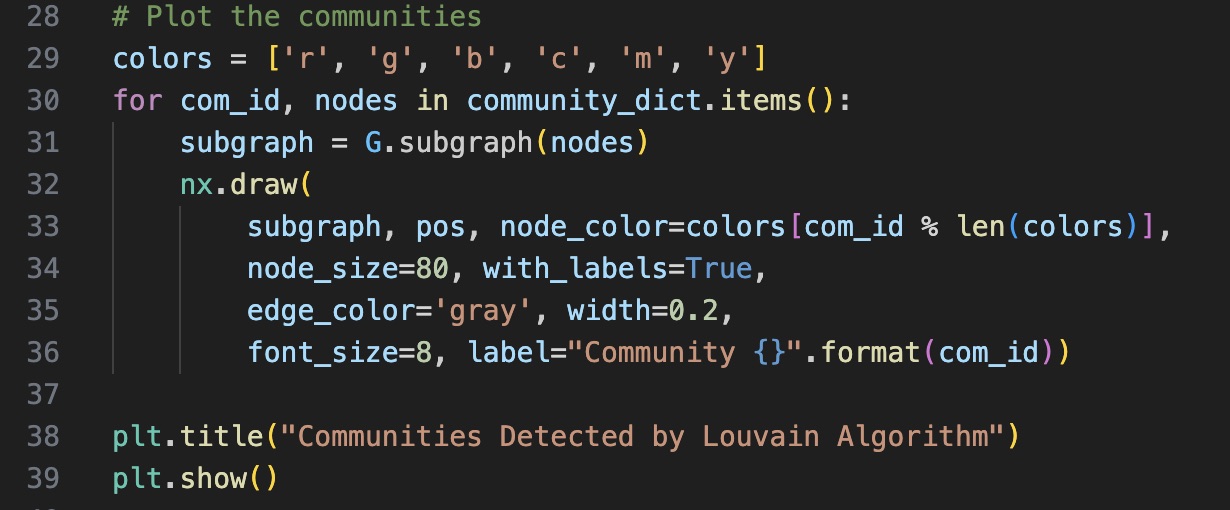 |
| Communities Detected |
 |
Extra
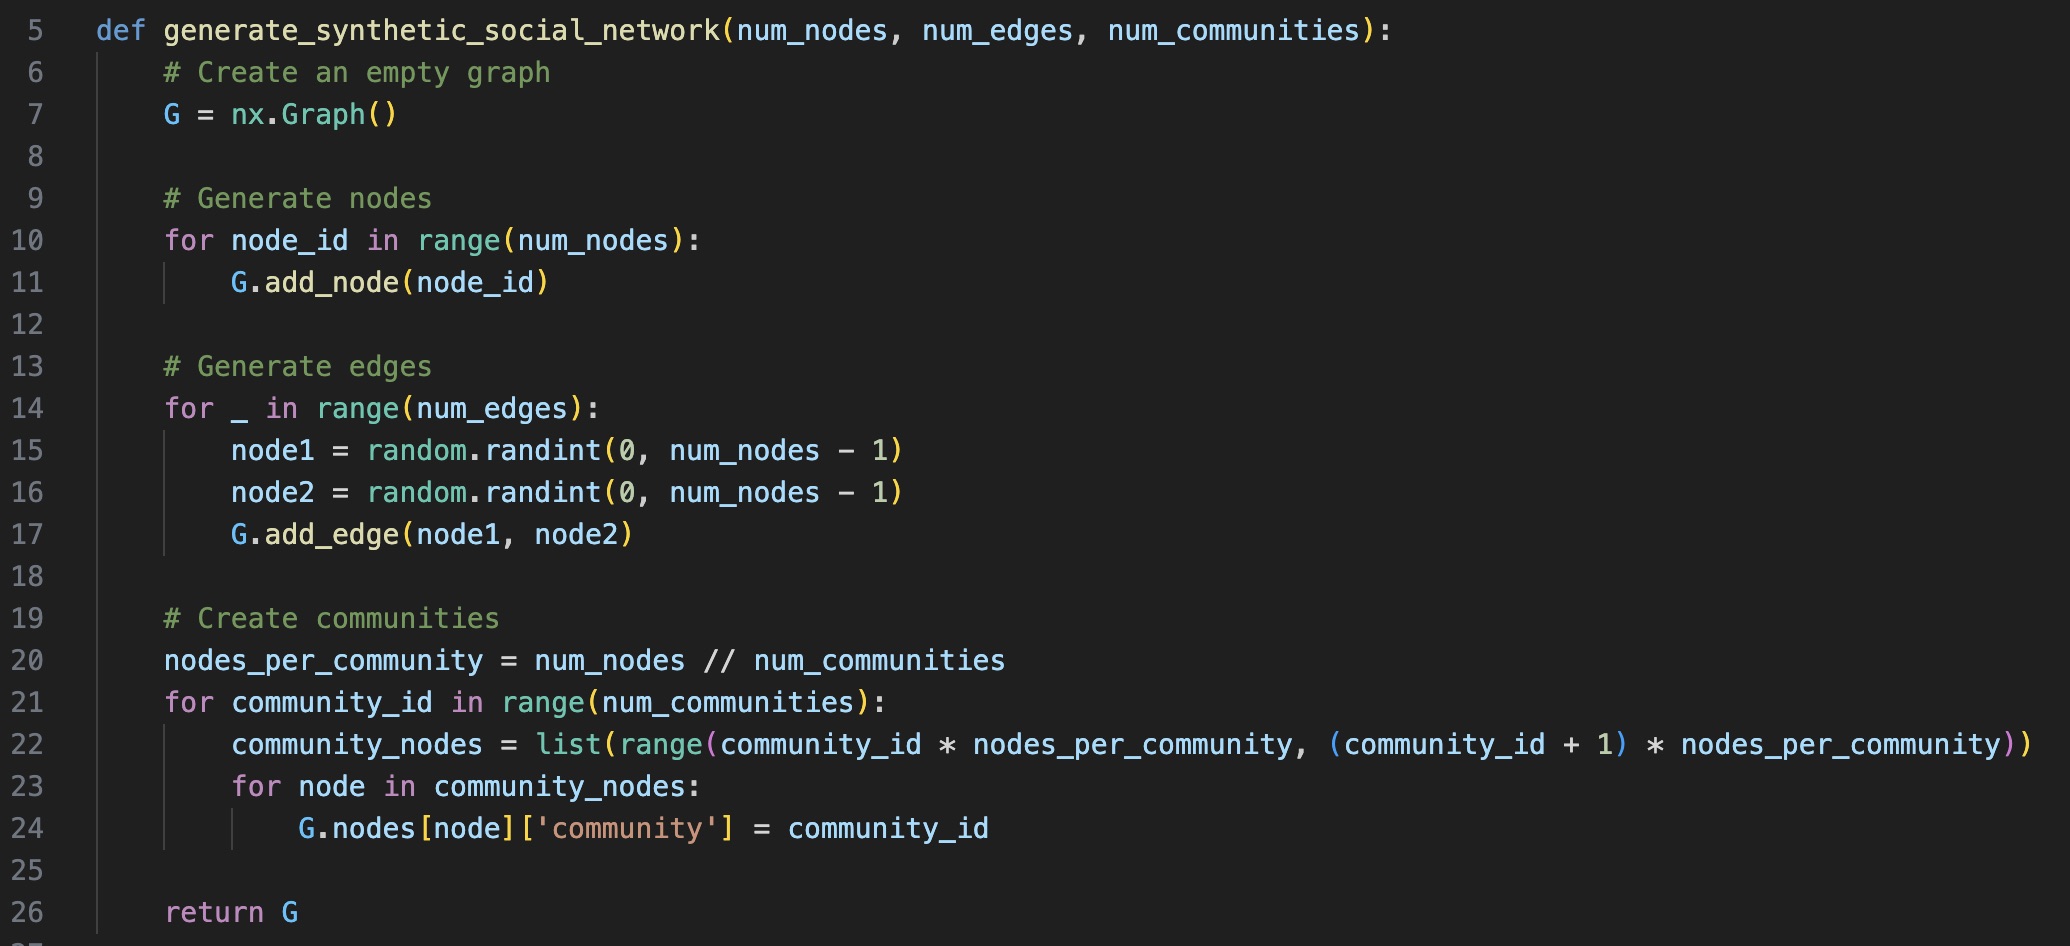
Here's a function to generate synthetic data of a social network that include several communities. Then we will create another function to visualise the synthetic social network showing the communities in different colours.
| Creating a Synthetic Social Network of Communities |
 |
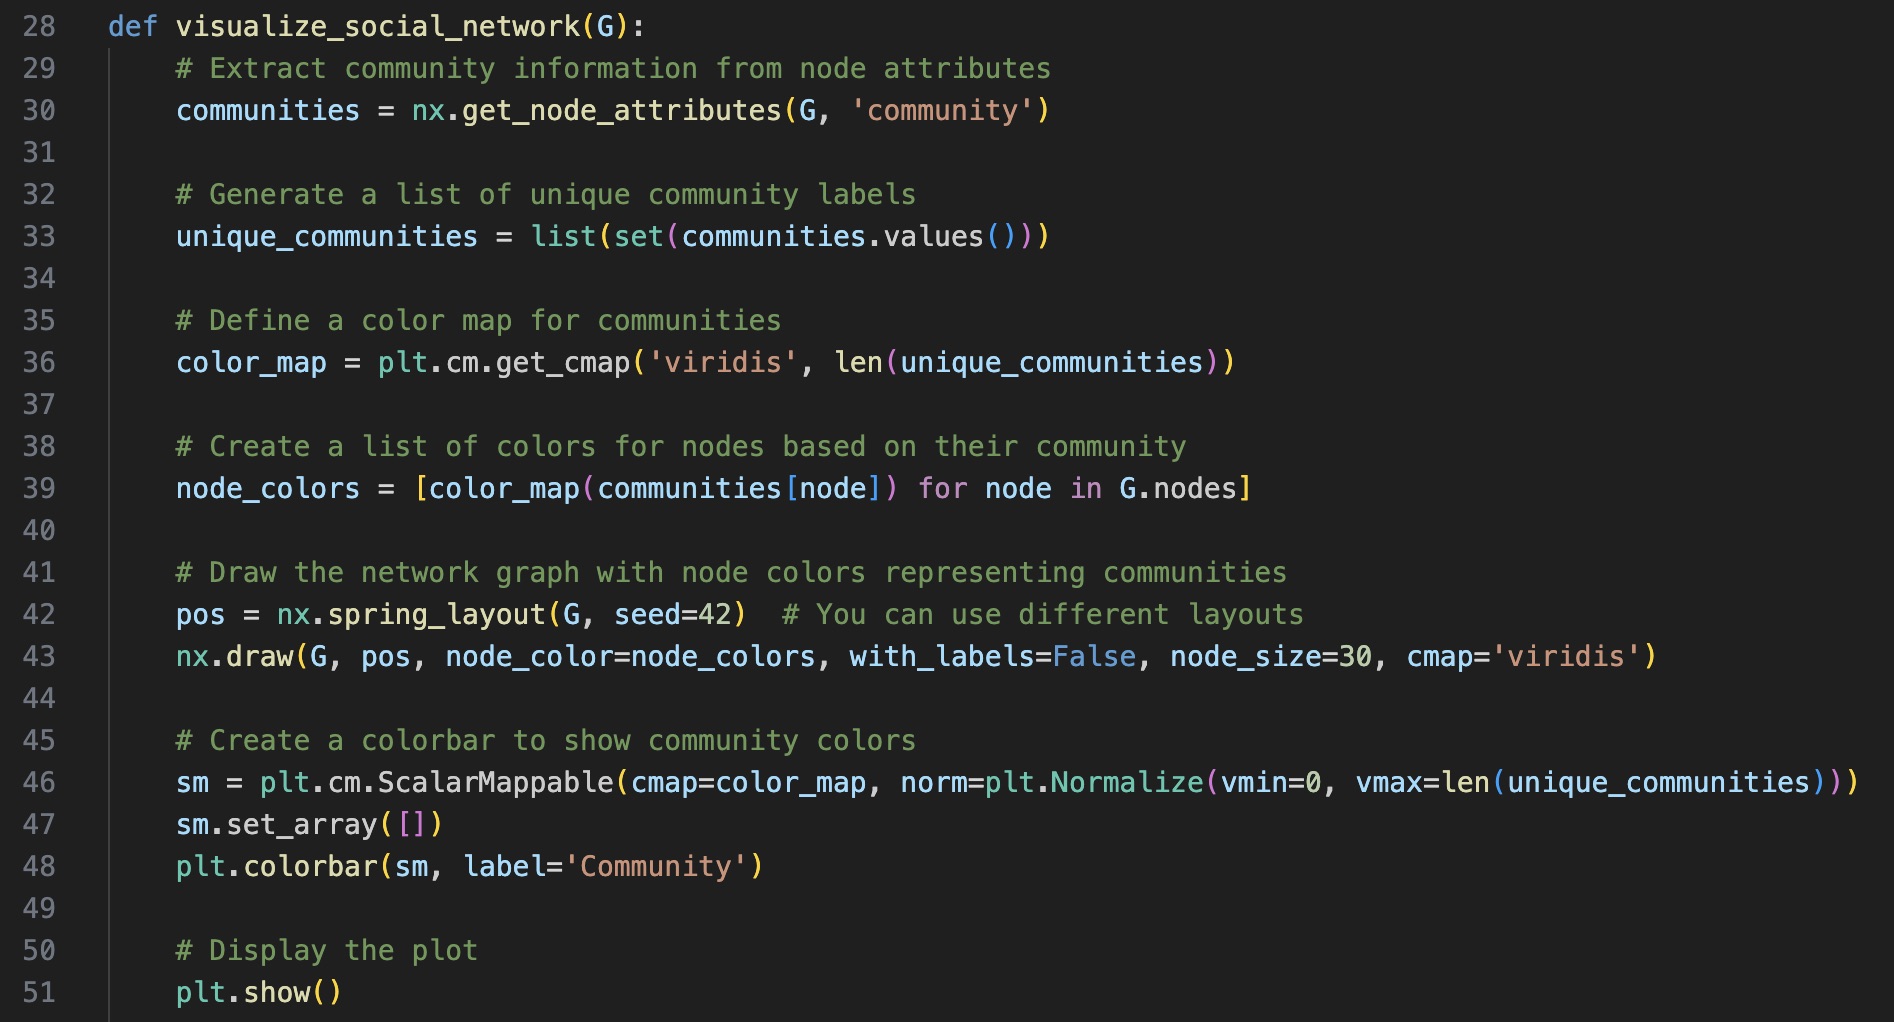
Next, visualise the network, different communities in different colours
| Visualising the Communities |
 |
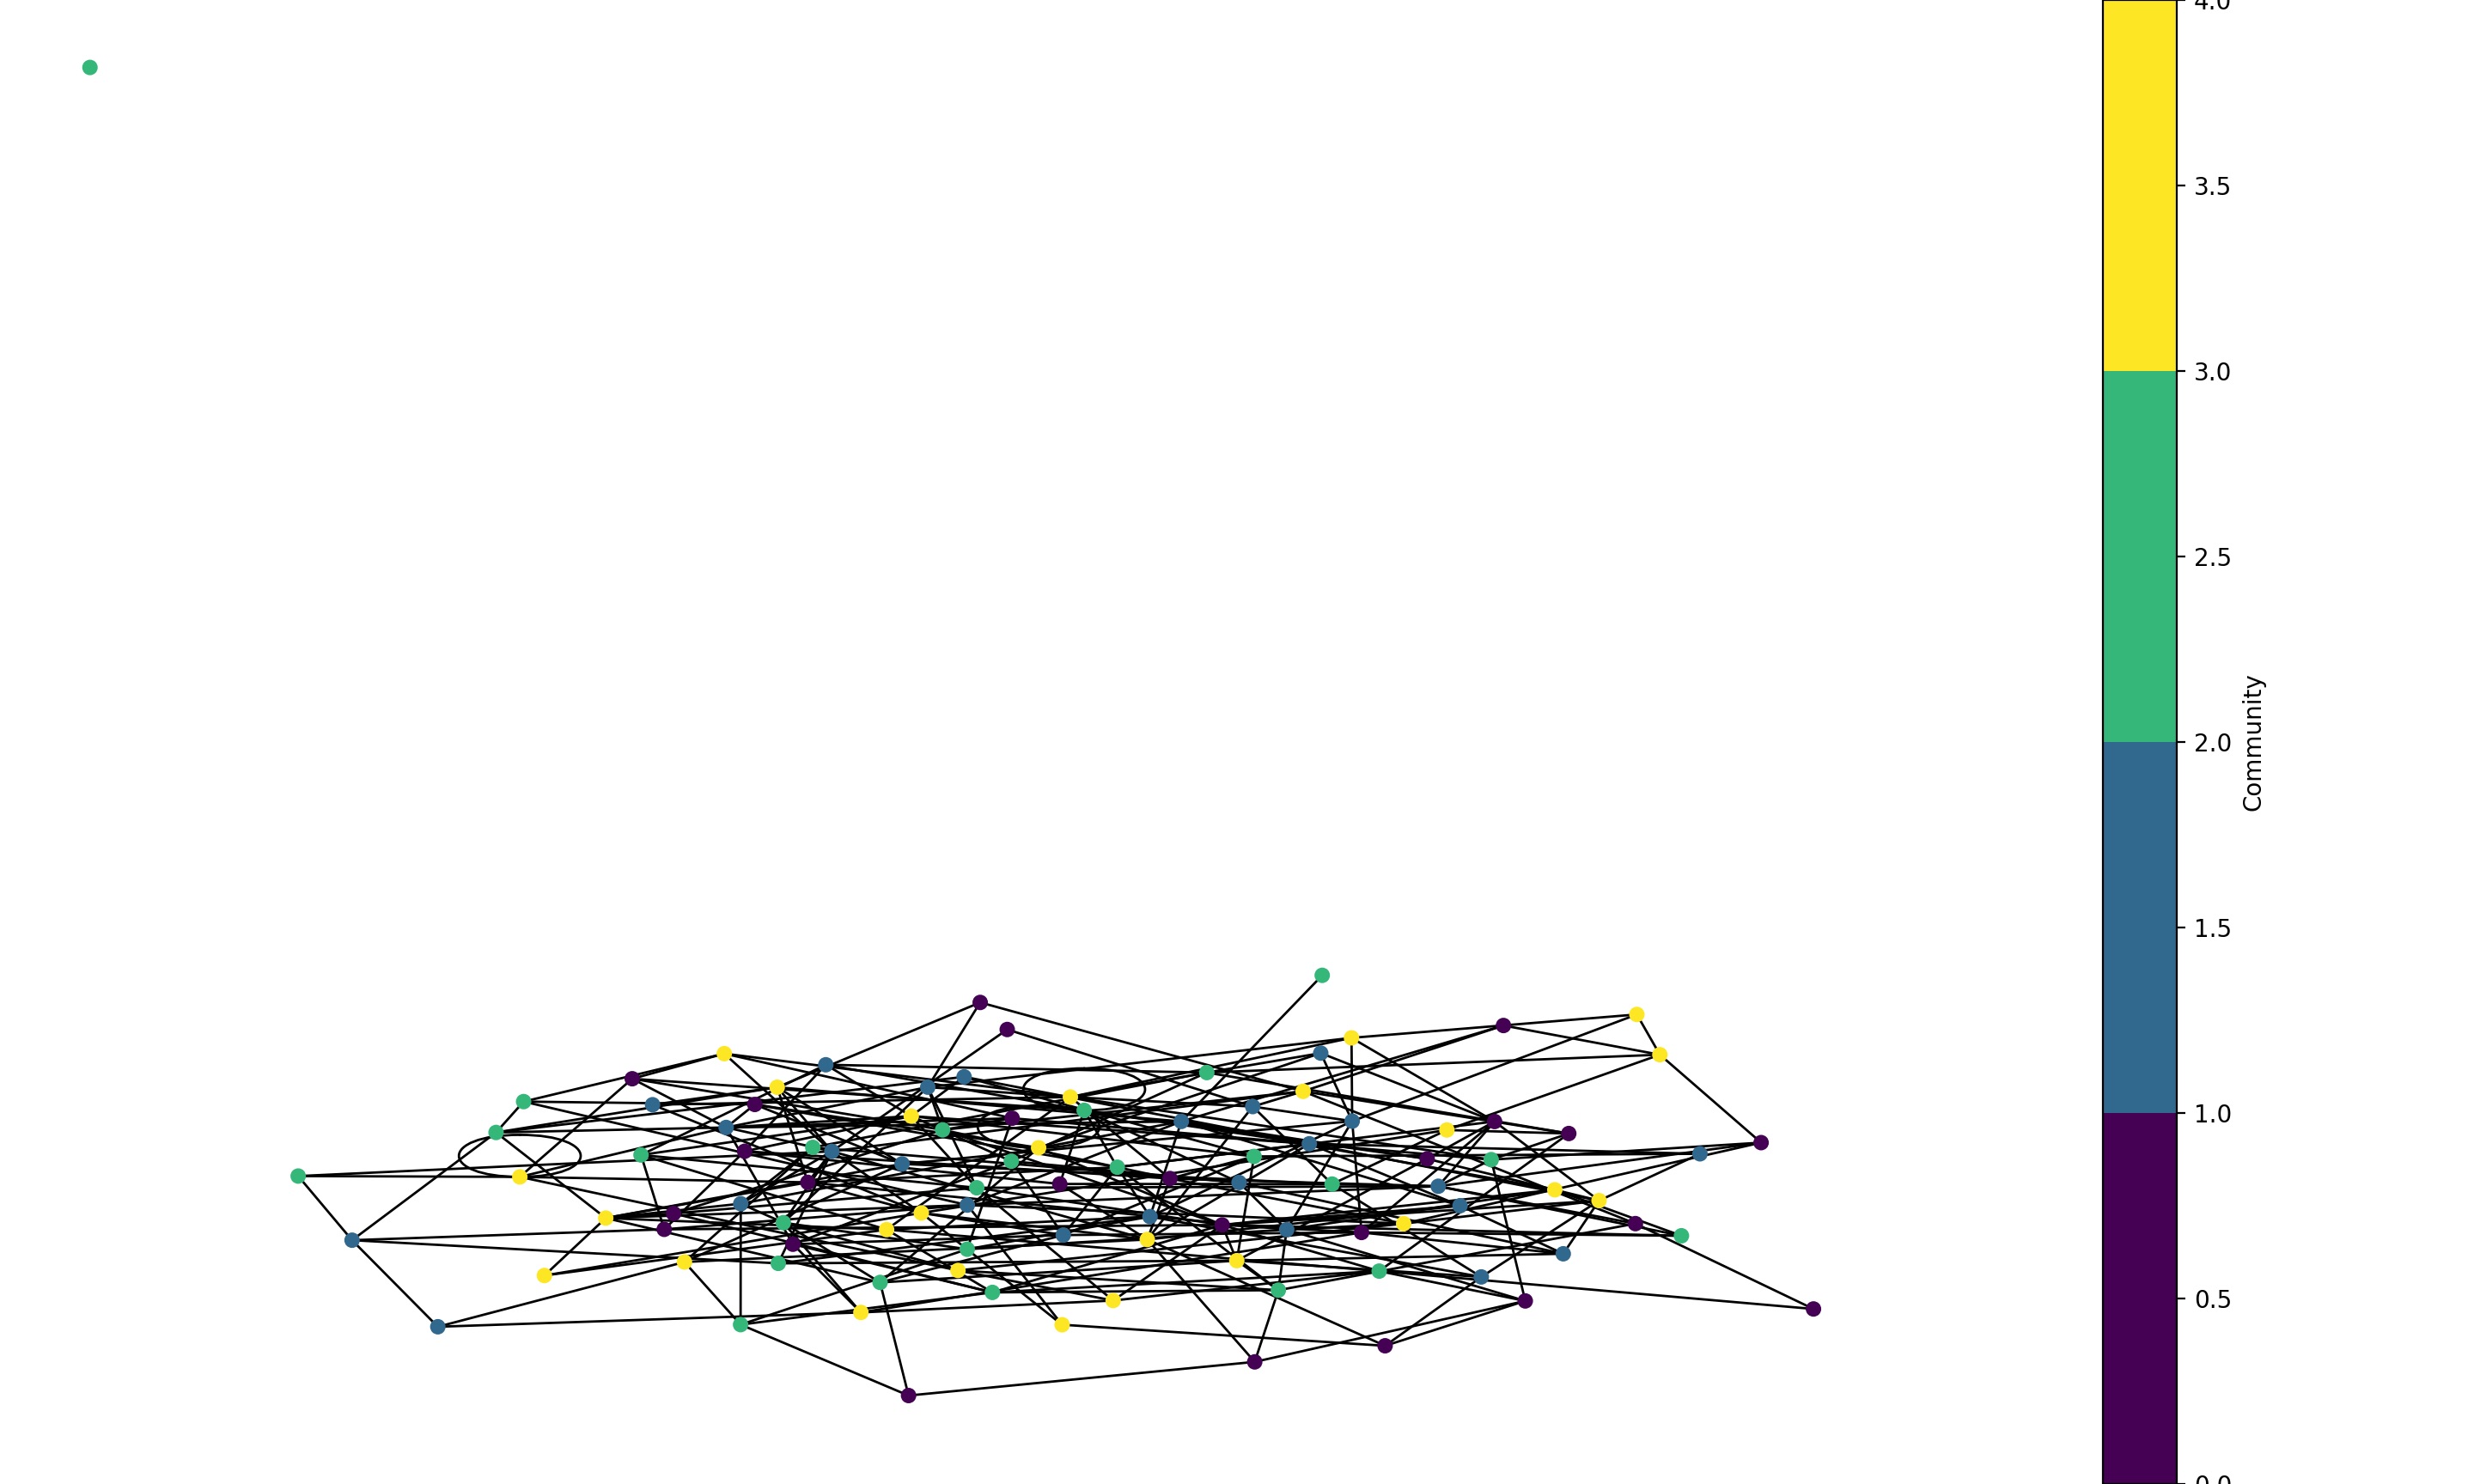 |
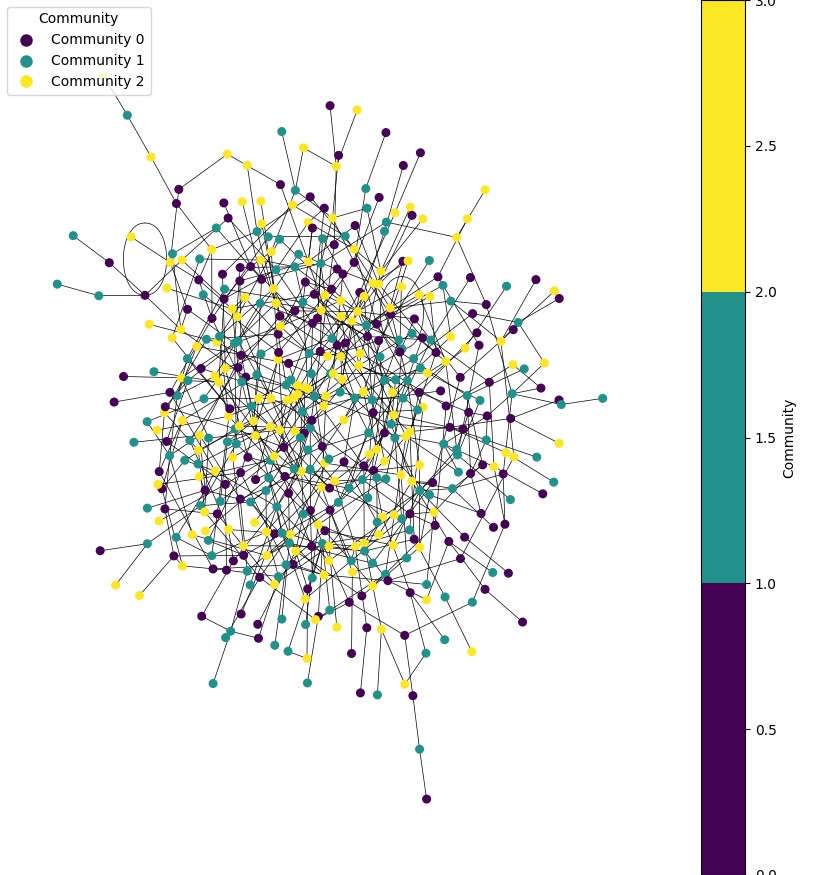
The color-coding of nodes represents the community to which they belong. Nodes of the same color are part of the same community.
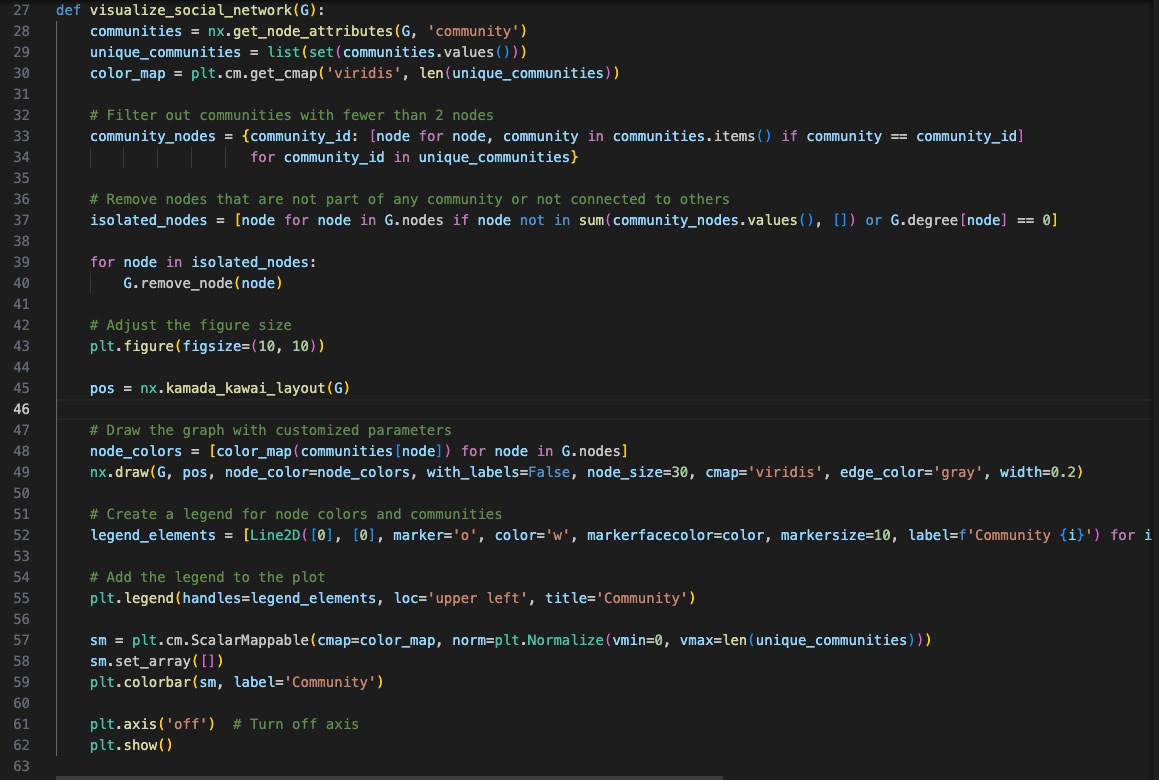
To enhance the visualisation of the graph, and spread it out more evenly, we can adjust the layout algorithm and adjust the figure size e.g. here we will use the kamada_kawai_layout algorithm.
| Adjusted Layout for Visualising Communities |
 |
| Code for Visualising Communities |
 |
Note:
The number of communities generated using the code above depends on the parameters specified when calling the generate_synthetic_social_network function.