In 3D graph visualization, the positioning of nodes plays a crucial role in conveying information effectively. By carefully arranging nodes in 3D space, we can create visualizations that reveal insights about your data.
-
Random Node Positions: By default, nodes are randomly positioned in 3D space. While this may work for small graphs, it can lead to cluttered and confusing visualizations for larger graphs.
-
Force-Directed Layouts: NetworkX provides several force-directed layout algorithms that can help you achieve aesthetically pleasing visualizations. These layouts aim to minimize the energy of the graph, effectively spreading out nodes and edges to reduce overlap. Some common force-directed layouts include the "spring layout" used here and the "Fruchterman-Reingold layout."
Fruchterman-Reingold Layout: This algorithm is based on a physical simulation where nodes repel each other, and edges act as springs, pulling connected nodes closer. It aims to minimize the energy of the graph to create an aesthetically pleasing layout.
Spring Layout: The spring layout, as used in the code, is a simplified force-directed layout. It models nodes as particles that are connected by springs. Nodes repel each other, and edges act as springs, but the algorithm may not have all the fine-tuned physics simulations of the Fruchterman-Reingold layout.
A Random 3D Graph
This code creates a random graph with nodes and edges and visualizes it in a 3D space.
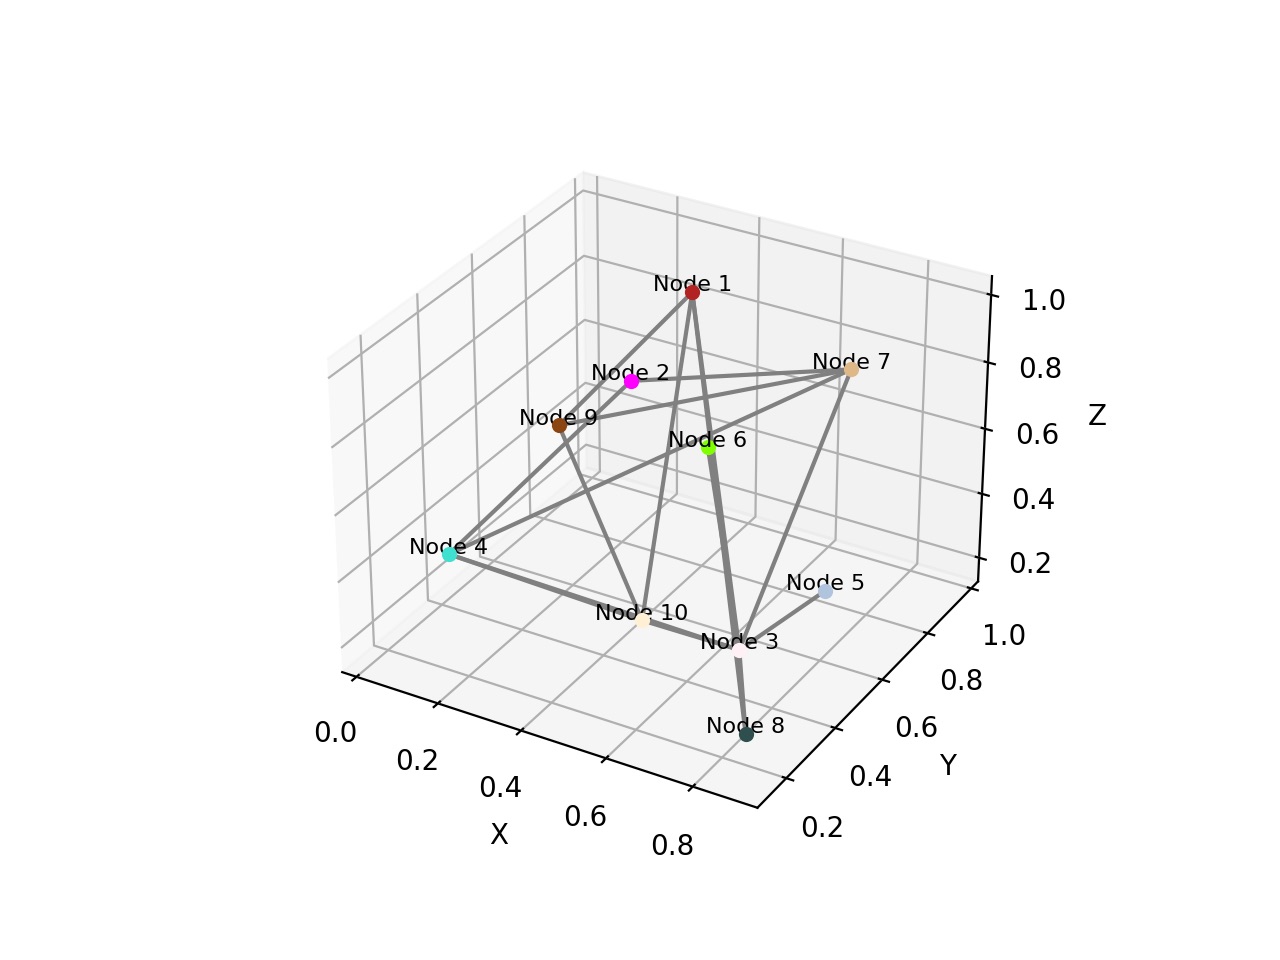
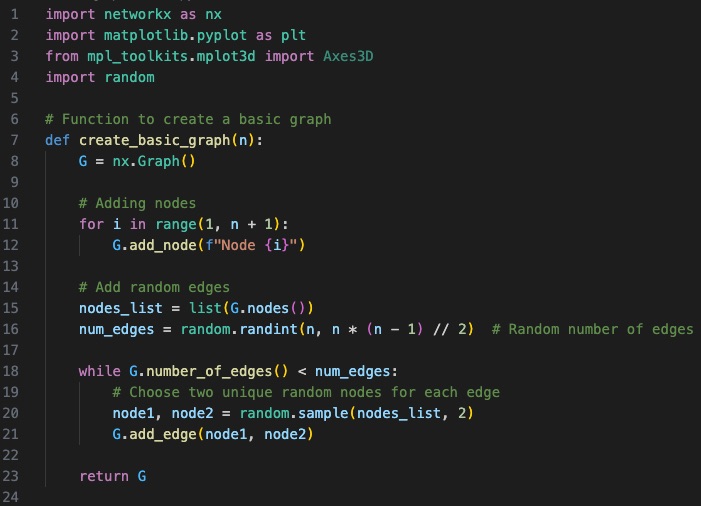
Let's go over the code and how it works:
create_basic_graph(n) is a function that creates a random graph with n nodes and a random number of edges. It starts by adding nodes labeled "Node 1," "Node 2," etc., up to "Node n." Then, it randomly adds edges between these nodes.
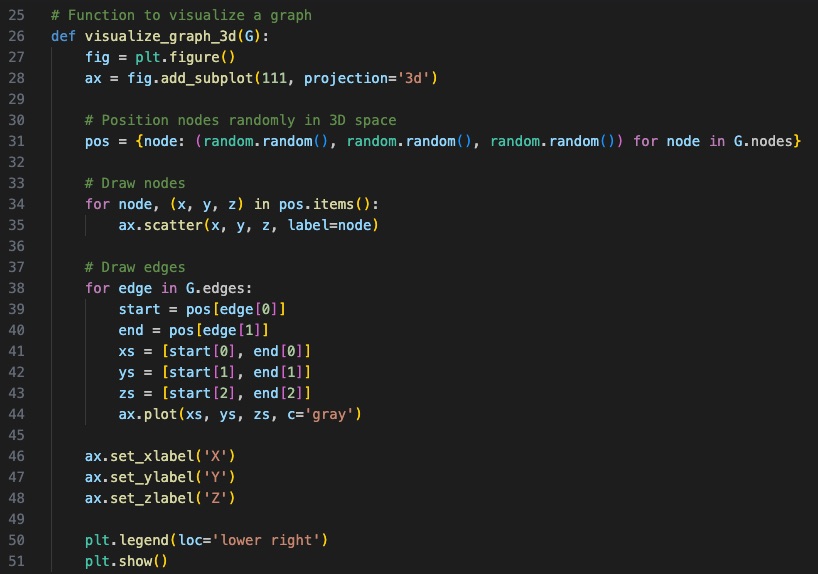
visualize_graph_3d(G) is a function that takes a graph G as input and visualizes it in 3D space using Matplotlib. It positions the nodes randomly in 3D space and draws nodes as scatter points and edges as lines.
Customising the 3D Graph
First, import the library
import matplotlib.colors as mcolors
In this enhanced code:
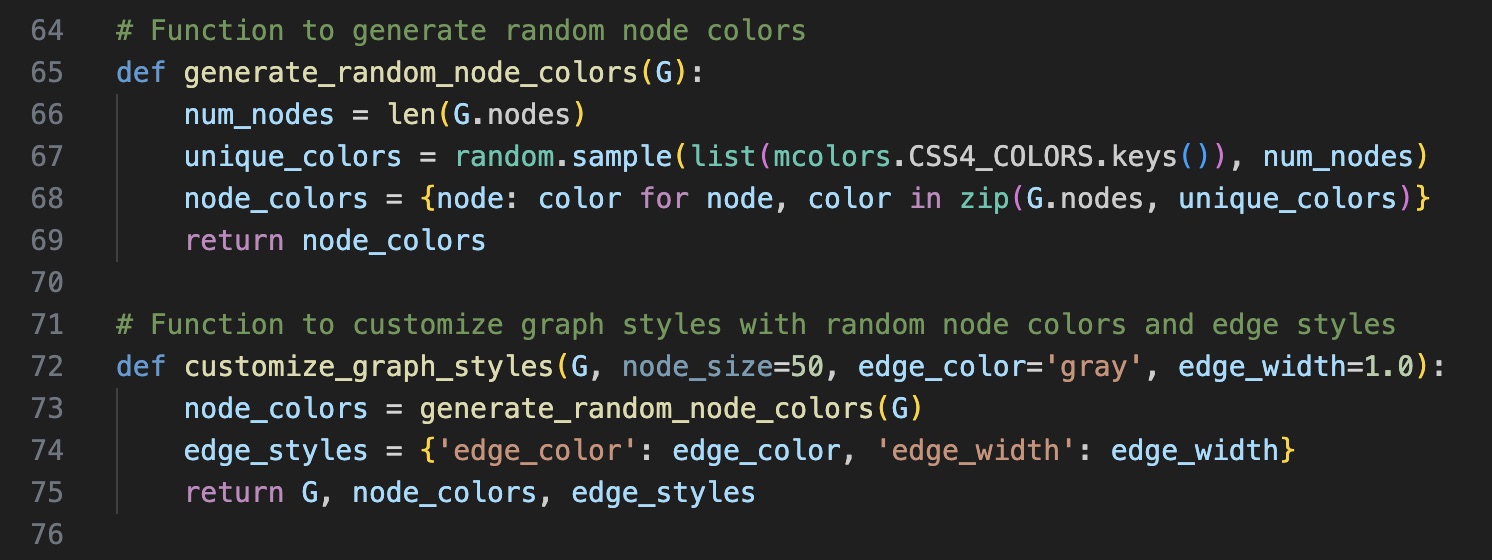
generate_random_node_colors generates a list of unique random colors using the CSS4 color names and assigns one color to each node in the graph.
customize_graph_styles now includes the node colors obtained from generate_random_node_colors.
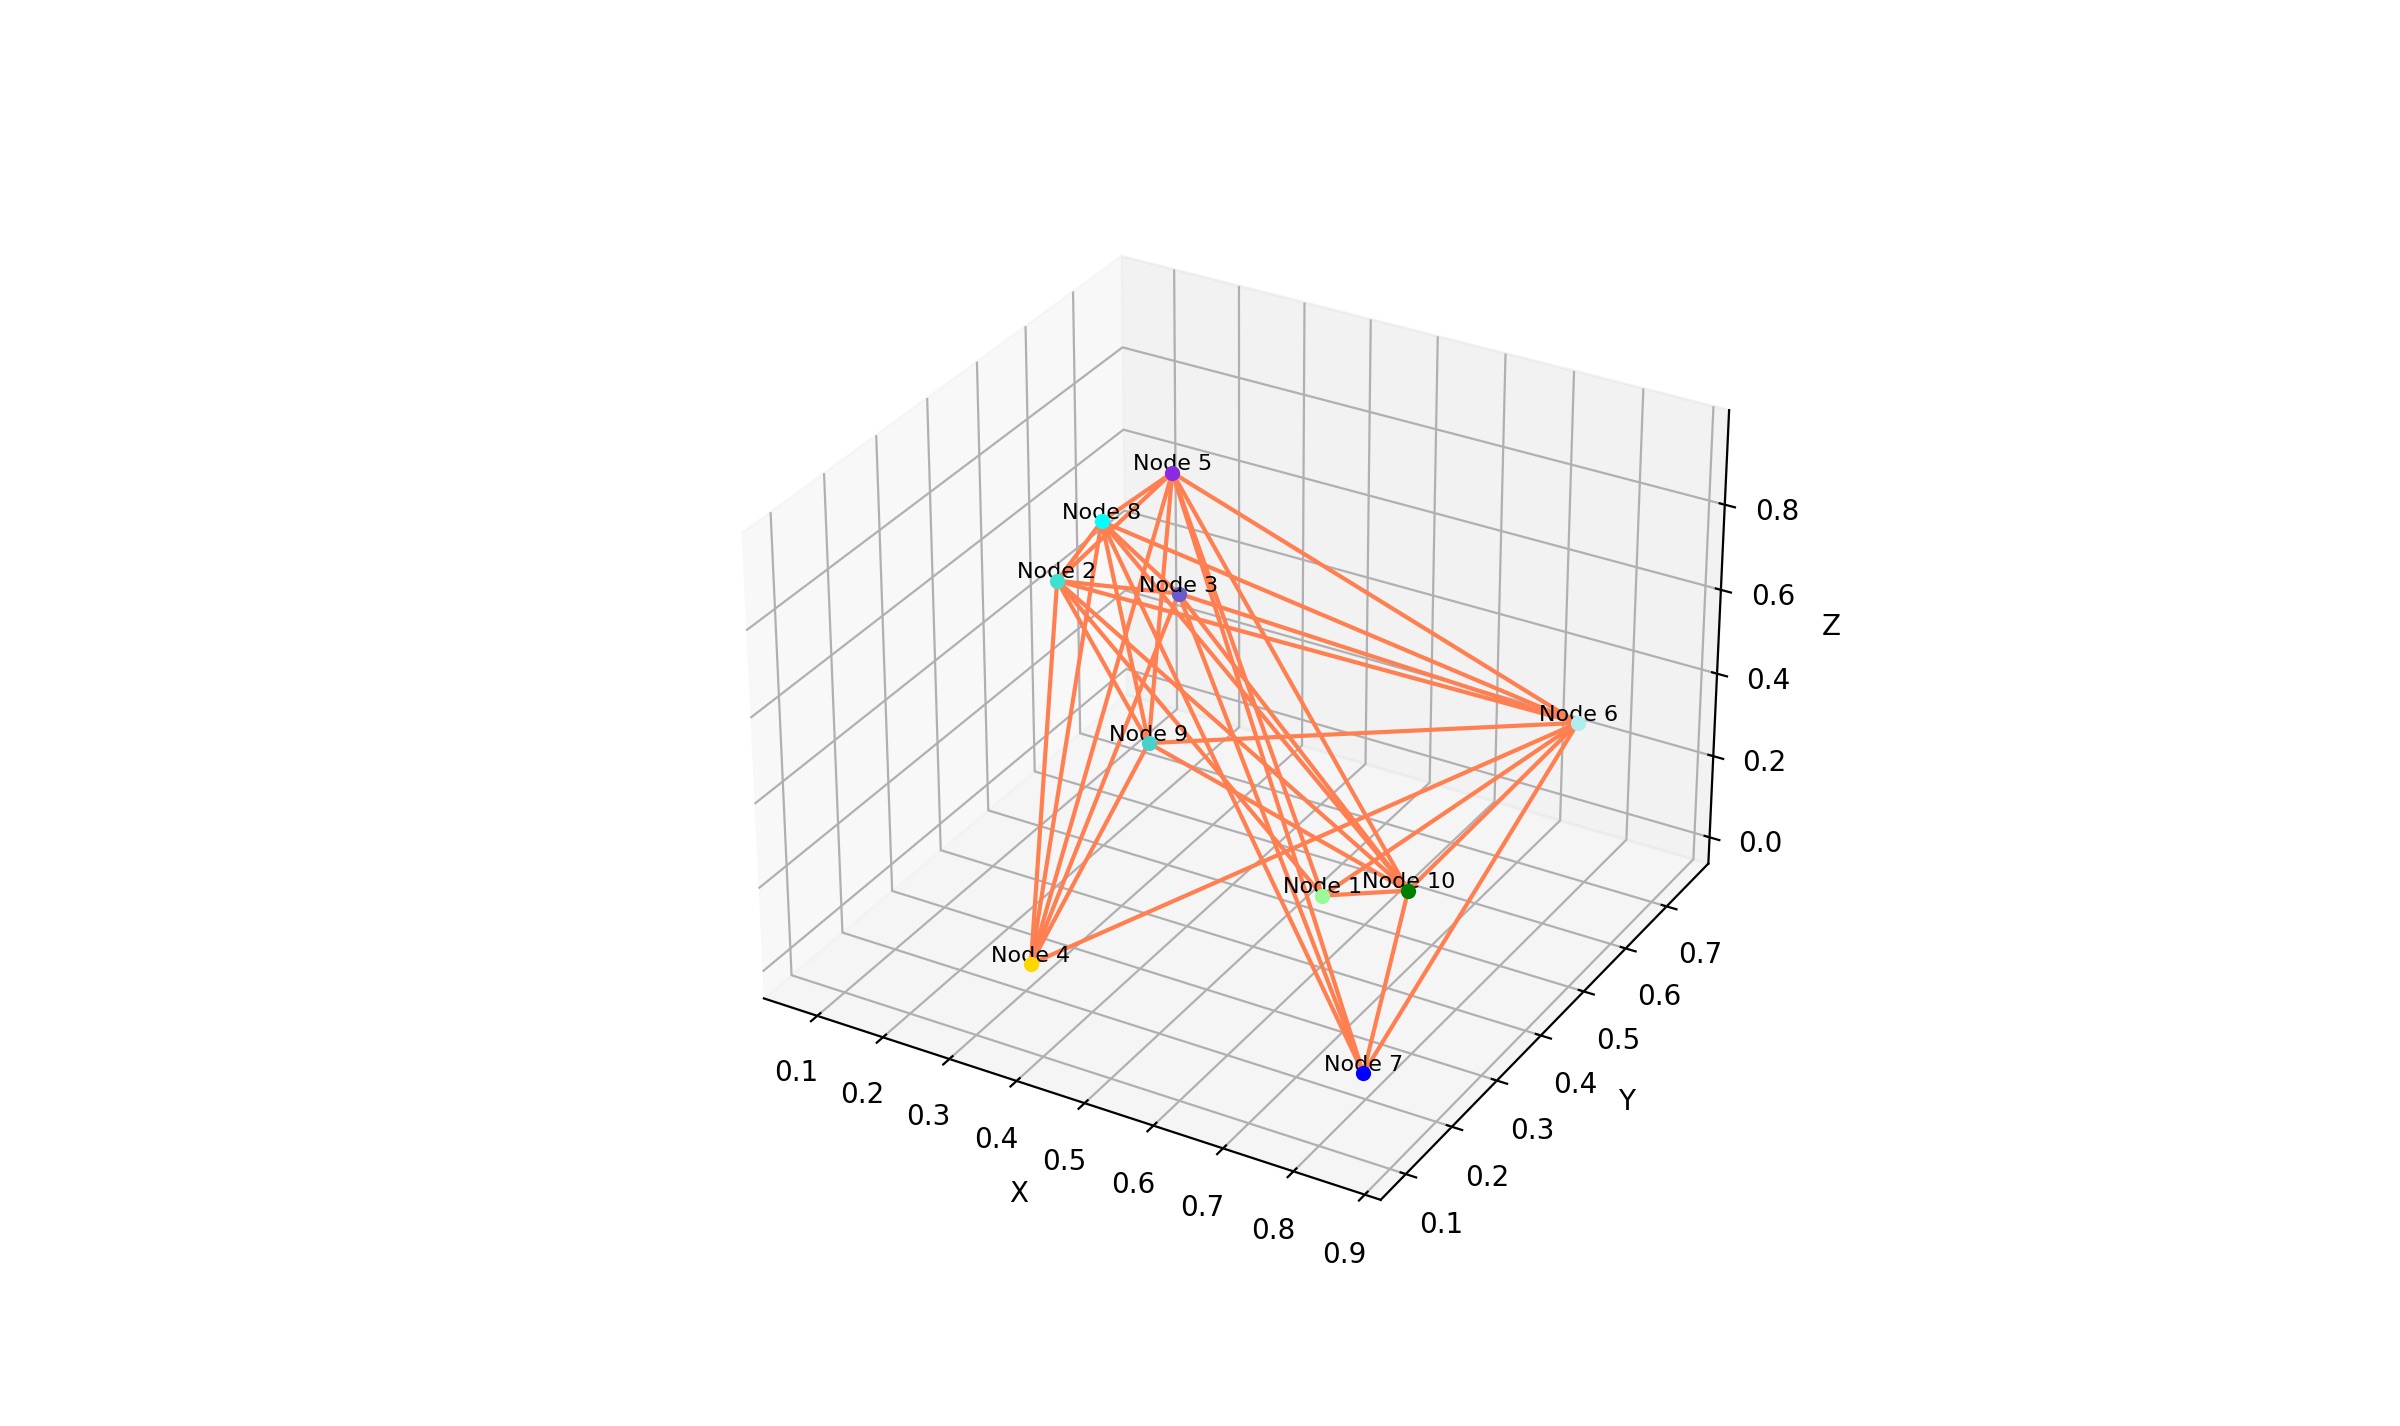
Customising Node Labels & Edges
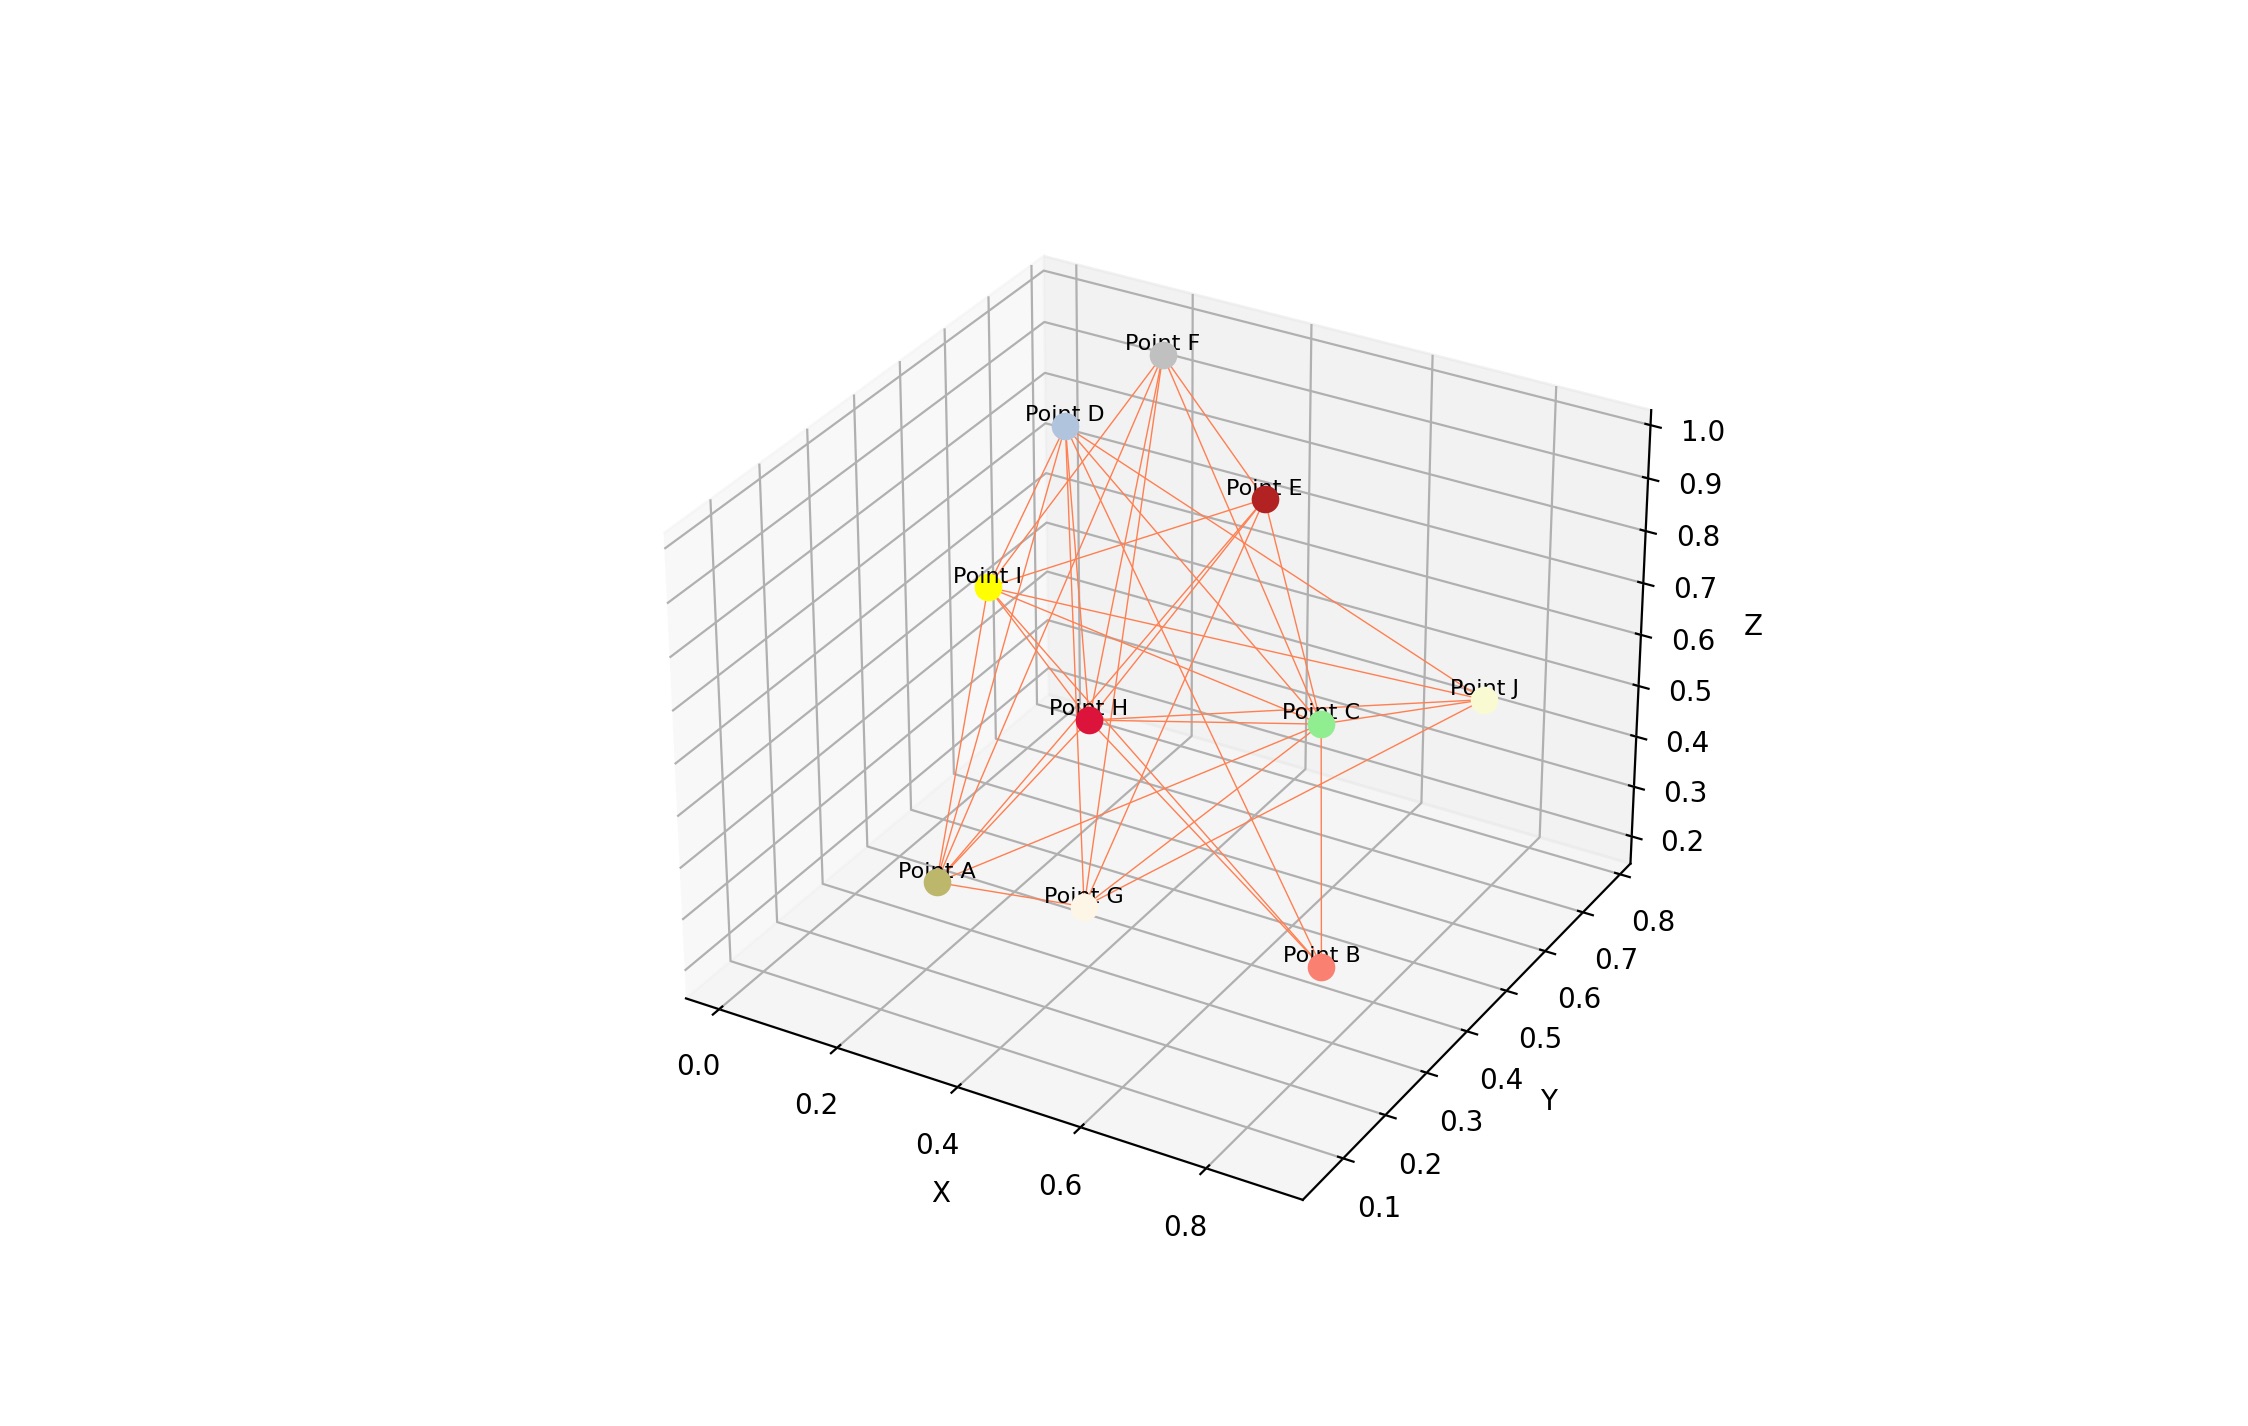
Changes made here:
- Instead of default Node 1, Node 2 etc... changed to Point 1, Point 2 etc

In this modified code, custom labels are generated using a loop. Further, string.ascii_uppercase from the string module is used to generate a sequence of uppercase letters ('A', 'B', 'C', ..., 'Z') that are assigned as custom labels to the nodes. The labels will cycle through the letters based on the number of nodes in the graph.
- Reduced the size of edges and nodes
customized_graph, edge_styles = customize_graph_styles(basic_graph, node_size=80, edge_color='#FF7F50', edge_width=0.5)
Note:
NetworkX supports various advanced features, including graph generators, graph serialization, and analysis functions. Explore the NetworkX documentation for a comprehensive list of features and examples.
This is just a basic introduction to using NetworkX for graph structure. The NetworkX documentation is a valuable resource for in-depth information and examples: https://networkx.github.io/documentation/stable/